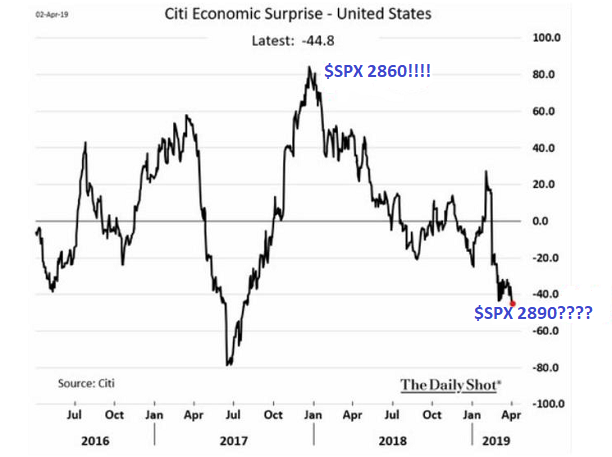
In January of 2018, the U.S. economy surprised to the upside at nearly every turn. Since that time, however, the fundamentals have slowly deteriorated.
Consider the Citi Economic Surprise Index (ESI). The popular measure compares actual data against estimates. Remarkably, the indicator has been trending downward for 15 months.
Perhaps ironically, the S&P 500 now trades at higher levels than when the fundamental backdrop had been much stronger. For many stock investors, then, weak fundamentals are synonymous with the exciting prospect of ever-lower borrowing costs and easy access to cheap capital.
Although the broader U.S. benchmarks are defying economic uncertainty, significant corners of the equity universe have yet to recover the highs that they reached in January of 2018. Financials (NYSE:XLF), Energy (NYSE:XLE), Transportation (NYSE:XTN), Value (NYSE:IWD) and All-World ex U.S. (NYSE:VEU) – these areas have been laboring for the last 15 months.
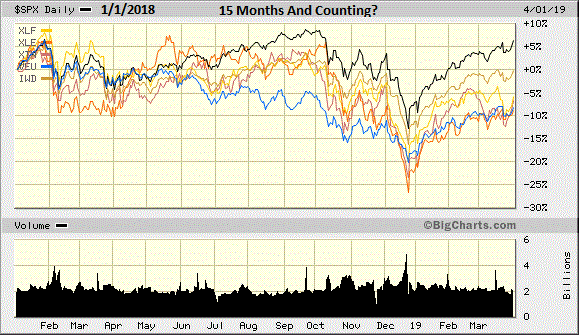
When it comes to propelling the S&P 500 higher, defensive late-cycle sectors like Utilities (NYSE:XLU) and Consumer Staples (NYSE:XLP) are helping to lead the charge. Indeed, a defensive equity approach may be a sensible path for participating in more upside while minimizing the possibility of a dramatic repricing of risk.
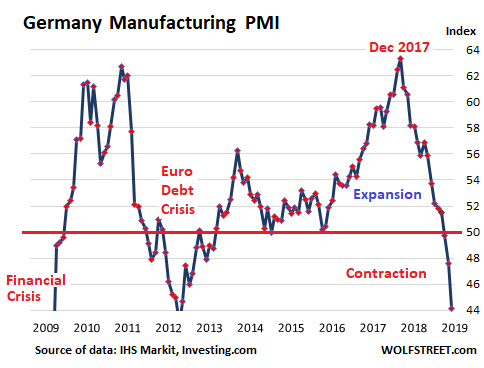
Global malaise is particularly burdensome. From Europe to Japan, Canada to Australia, growth has softened considerably.
For example, German GDP is predicted to grow at just 0.8% for 2019. And its manufacturing sector has experienced three consecutive months of full-blown contraction.
In fact, troubles abroad are having a decidedly negative impact on the earnings per share (EPS) of S&P 500 corporations. Some analysts are forecasting earnings growth of 1.5% for the entirety of 2019. That’s a far cry from the 20% EPS advance in 2018.
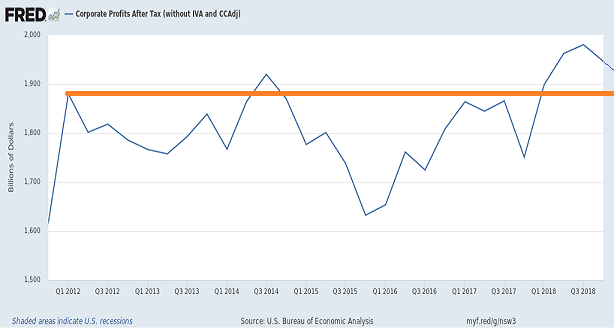
In actuality, the earnings per stock share picture fails to tell the true story. Profitability looks “okay” because the number of stock shares in existence has decreased considerably. True profits are stuck back in 2012.
Most understand why earnings per share (EPS) continue to seem reasonable in the forward price-to-earnings metric. Former Federal Reserve committee member Bill Dudley recently stated, “During this expansion, companies have levered up, borrowing money to buy back shares and deliberately allowing their credit ratings to decline.”
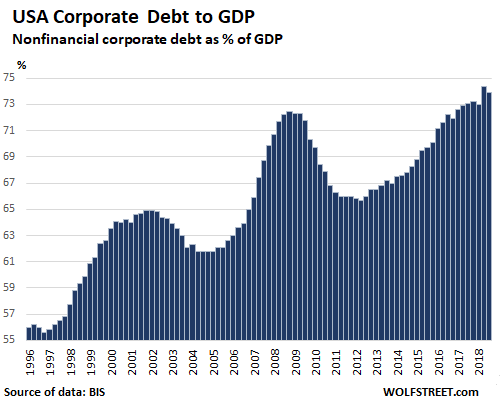
The humor in Dudley’s assessment? He refused to acknowledge the Fed’s role in depressing the cost of capital; that is, when the central bank manipulated rates lower for the better part of a decade, the traditional easing and quantitative easing (QE) policies led corporations to lever up to record debt levels for the purpose of goosing stock prices.
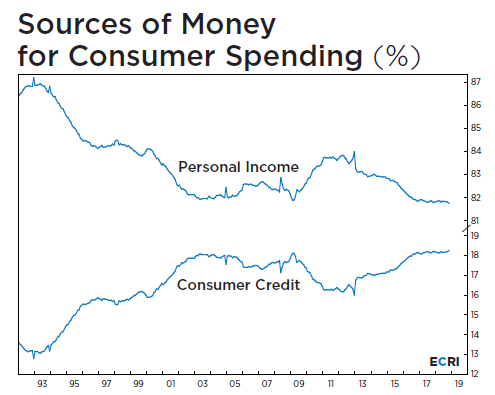
Consumers have shown more restraint. Yet they too have been showing signs of stress.
Personal income as a source of spending has been hitting lower lows. Meanwhile, they’re increasingly employing credit to meet their spending needs and desires.
On the labor force front, ADP found that businesses added personnel at the slowest pace in 18 months. Friday’s BLS report, however, pointed to nearly 200,000 new positions in March.
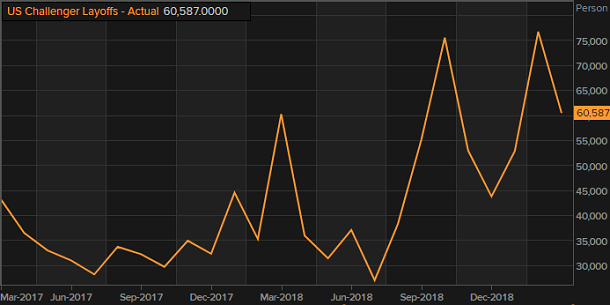
Other data show that the number of people filing for unemployment benefits just hit a 49-year low. That statistic seems to contradict the rising trend in layoffs.
What might one do with the wide variety of evidence that contradicts and confounds? Listen to the bond market.
The 3-month T-Bill yields more than the 1-year Treasury. The 3-month actually yields more than the 1-year, 2-year, 5-year and 7-year. Inversions along the Treasury curve are exceptionally reliable in forecasting recessionary pressures.
We have already seen the stock market reclaim losses on the heels of a monstrous Fed pivot form tightening to neutrality. Moreover, the bulk of China trade optimism is largely priced in. Is there reason to believe in additional catalysts for supersized stock gains from here?
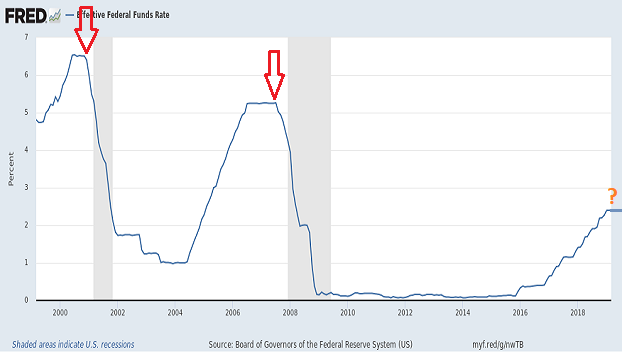
The Fed pivot only bought a reprieve. The last three recessions occurred shortly after the Fed began cutting rates for the first time in a campaign.
Throughout the risk asset mauling in the 4th quart of 2018 as well as the risk asset recovery in 2019, we have increased client exposure to high quality corporate bonds and high quality preferred stock. Exchange-traded fund investors may want to look at iShares Aaa-A Rated Corproate Bond (NYSE:QLTA).
We have also decreased our exposure to growth stocks by favoring defensive stock assets as well as low volatility ETFs. Significant holdings for our near-retiree and retiree client base include iShares MSCI Minimum Volatility (NYSE:USMV), Health Care Select Sector SPDR (NYSE:XLV) and SPDR S&P 500 High Dividend (NYSE:SPYD).
