Improving trade surplus bullish for AU200
Trade surplus and retail sales rose in Australia. Will the AU200 stock index continue advancing?
Recent economic data from Australia were positive: Australia's retail sales rose in May and trade surplus hit record high. Retail sales rose by 0.1% in May after 0.1% decline in April, driven by stronger spending in restaurants and on household goods. Australia's trade surplus rose to a record A$5.745 billion in May following A$4.820 billion surplus in April, as exports rose by 4%, while imports rose by 1%.
The increasing export was supported by rising prices for commodities as well as weaken currency as the Reserve Bank of Australia lowered interest rates. The Reserve Bank of Australia cut interest rates for the second time in as many months on Tuesday to 1.00%, down from 1.25%, adding to a cut in June. Rising trade surplus and consumer sentiment is bullish for Australia’s stock market index.

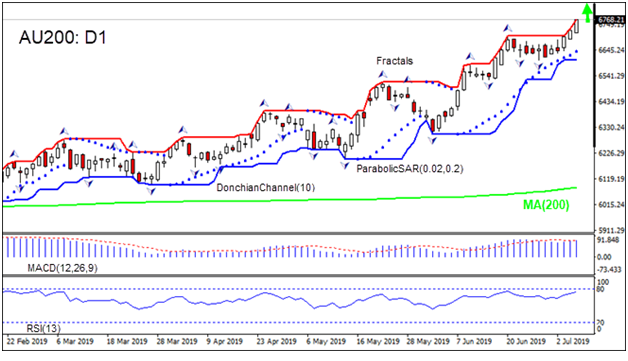
On the daily timeframe AU200: D1 is gaining after hitting seven-month low in the end of February.
- The Donchian channel indicates an uptrend: it is widening upward.
- The Parabolic indicator has formed a buy signal.
- The MACD indicator is above the signal line and the gap is widening, which is a bullish signal.
- The RSI oscillator is rising and is reaching the overbought zone.
We believe the bullish momentum will continue after the price closes above the upper boundary of Donchian channel at 6768.61. This level can be used as an entry point for placing a pending order to buy. The stop loss can be placed below the lower Donchian boundary at 6605.31. After placing the order, the stop loss is to be moved every day to the next fractal low, following Parabolic signals.
Thus, we are changing the expected profit/loss ratio to the breakeven point. If the price meets the stop loss level (6605.31) without reaching the order (6768.61), we recommend cancelling the order: the market has undergone internal changes which were not taken into account.
Technical Analysis Summary
| Position | Buy |
| Buy stop | Above 6768.61 |
| Stop loss | Below 6605.31 |
Market Overview
Futures indicate higher US market opening today
Dollar strengthens ahead of June jobs report
U.S. stock market will reopen today after Independence Day holiday. All three main U.S. indexes logged record high closings on Wednesday. Futures on three main U.S. stock indices indicate higher openings today. The dollar declined yesterday: the live dollar index data show the ICE (NYSE:ICE) US Dollar index, a measure of the dollar’s strength against a basket of six rival currencies, slipped 0.02% to 96.73 but is higher currently ahead of June jobs report which is expected to help make or break the case for a rate cut later in July.
DAX 30 gained while other European indexes slipped
European stocks advanced for sixth straight session on Thursday led by Italian stocks after Italy persuaded the European Commission that new measures submitted this week would help bring its growing budget deficit in line with EU fiscal rules. EUR/USD inched up while GBP/USD continued its slide with both pairs reversing currently. The Stoxx Europe 600 index ended 0.1% higher. Germany’s DAX 30 gained 0.1% to 12629.90. France’s CAC 40 slipped 0.03% and UK’s FTSE 100 slid 0.1% to 7603.58.
Australia’s All Ordinaries still leads Asian indexes
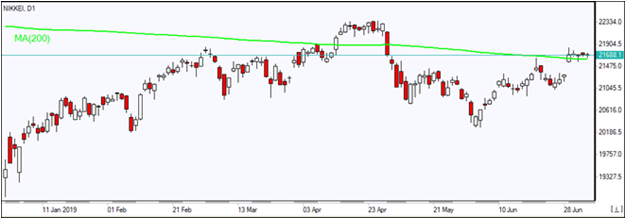
Asian stock indices are mostly rising today. Nikkei rose 0.2% to 21746.38 as yen resumed its slide against the dollar. Chinese shares are gaining as markets await resumption of US-China talks and Beijing said tariffs on Chinese goods must be completely removed if a deal is reached: the Shanghai Composite Index is up 0.19% while Hong Kong’s Hang Seng Index is 0.1% lower. Australia’s All Ordinaries Index rose another 0.5% with Australian dollar’s decline against the greenback intact.

Brent down
Brent futures prices are extending losses today. Prices fell yesterday: September Brent crude lost 0.8% to $63.26 a barrel on Thursday.
