Stocks fell by almost 2.2% on April 15, nearly erasing all of Tuesday's gains. Perhaps this is the start of a new trend; maybe it isn’t. I happen to believe this is the start of a new direction as investors focus begins to shift from the actual coronavirus to the pain it is inflicting on the economy, which is severe and making 2008 seem like child’s play.
The worst part about all of this is that the longer the virus remains, the more significant the economic damage will be. NY will now be instituting a new executive order requiring all residents to wear a mask when in public. The state will also begin conducting antibody testing for frontline workers starting this week, with 2,000 tests per day. Could it be the start of the opening of NY state? Maybe. But let’s hope the number of test rises dramatically because NY state has about 20 million people.
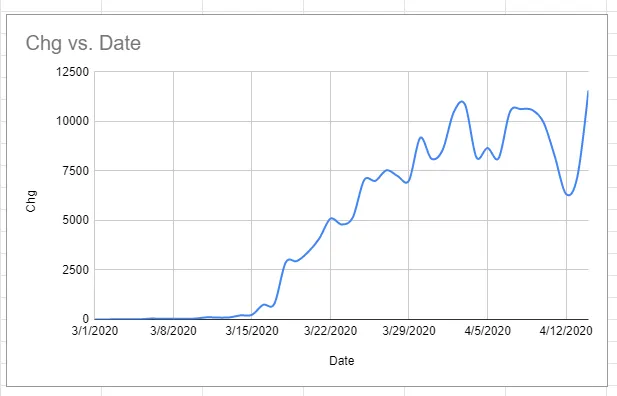
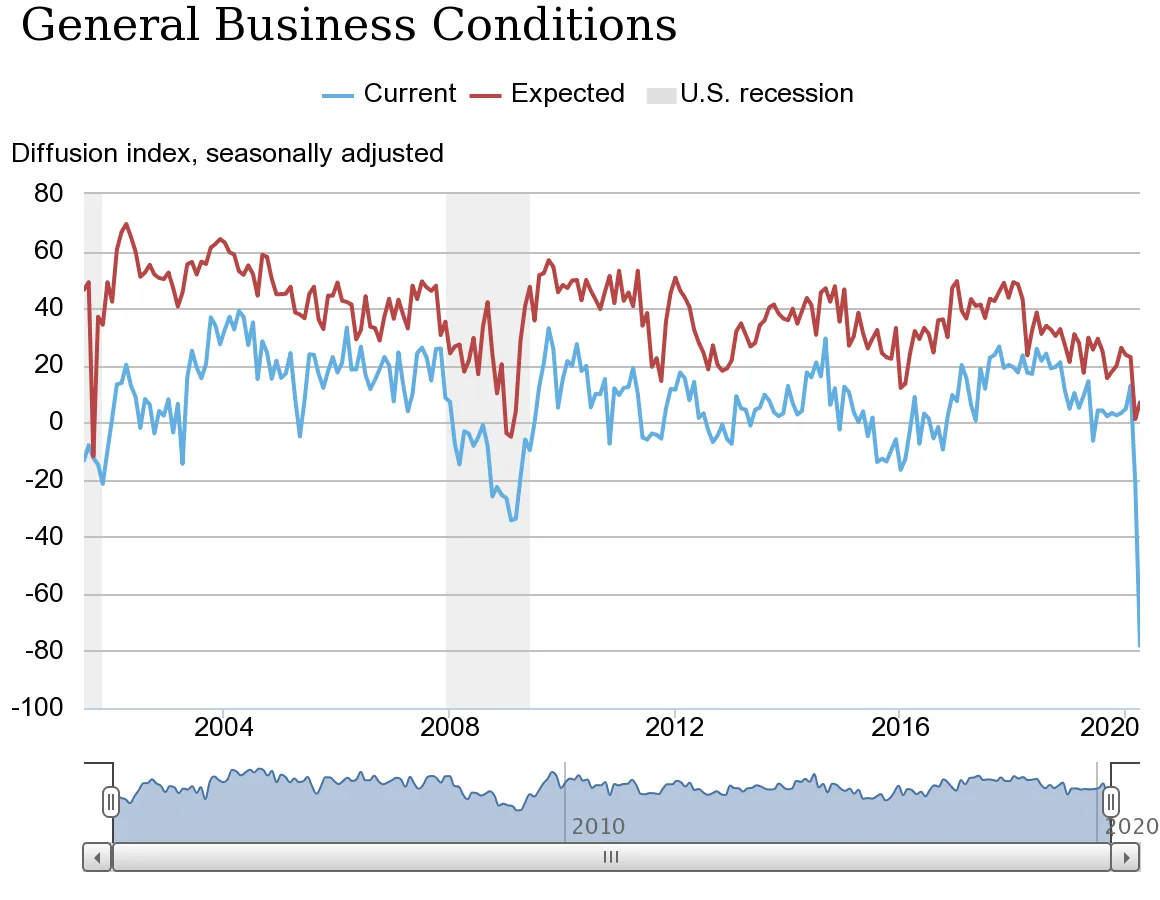
Anyway, speaking of NY, the Empire State Manufacturing Survey, had its worst reading ever, a -78.2.
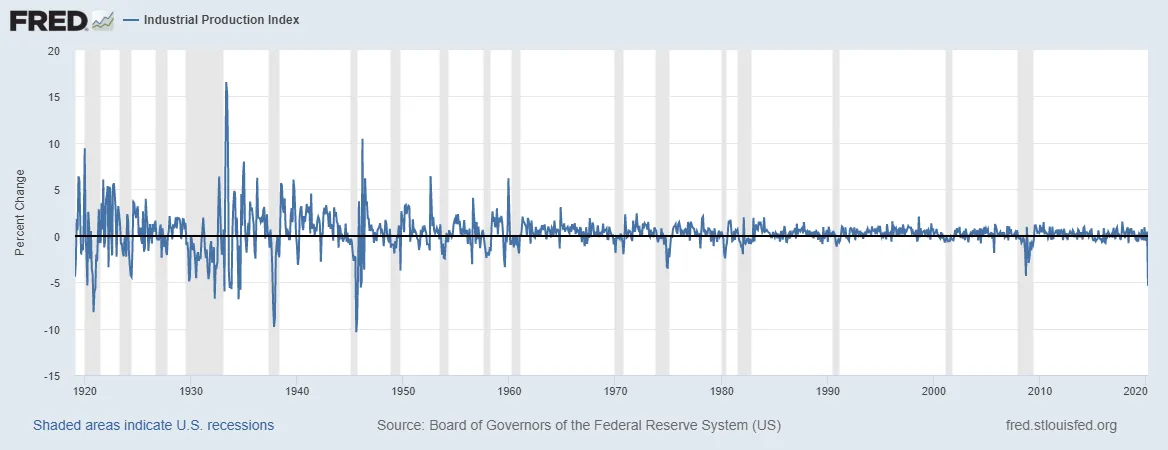
But wait! It gets worse because industrial production fell by -5.4% month over month, its most significant drop since 1946! Yes, that means it was worse than 2008’s decline of 4.3%.
Retail sales for March fell by 8.7%.
But that’s ok because we knew this data was going to be bad, right? We shut the economy down, and once we flip the switch back on, everything will be fine. Keep telling yourself that. It doesn’t work like that.
S&P 500 (SPY)
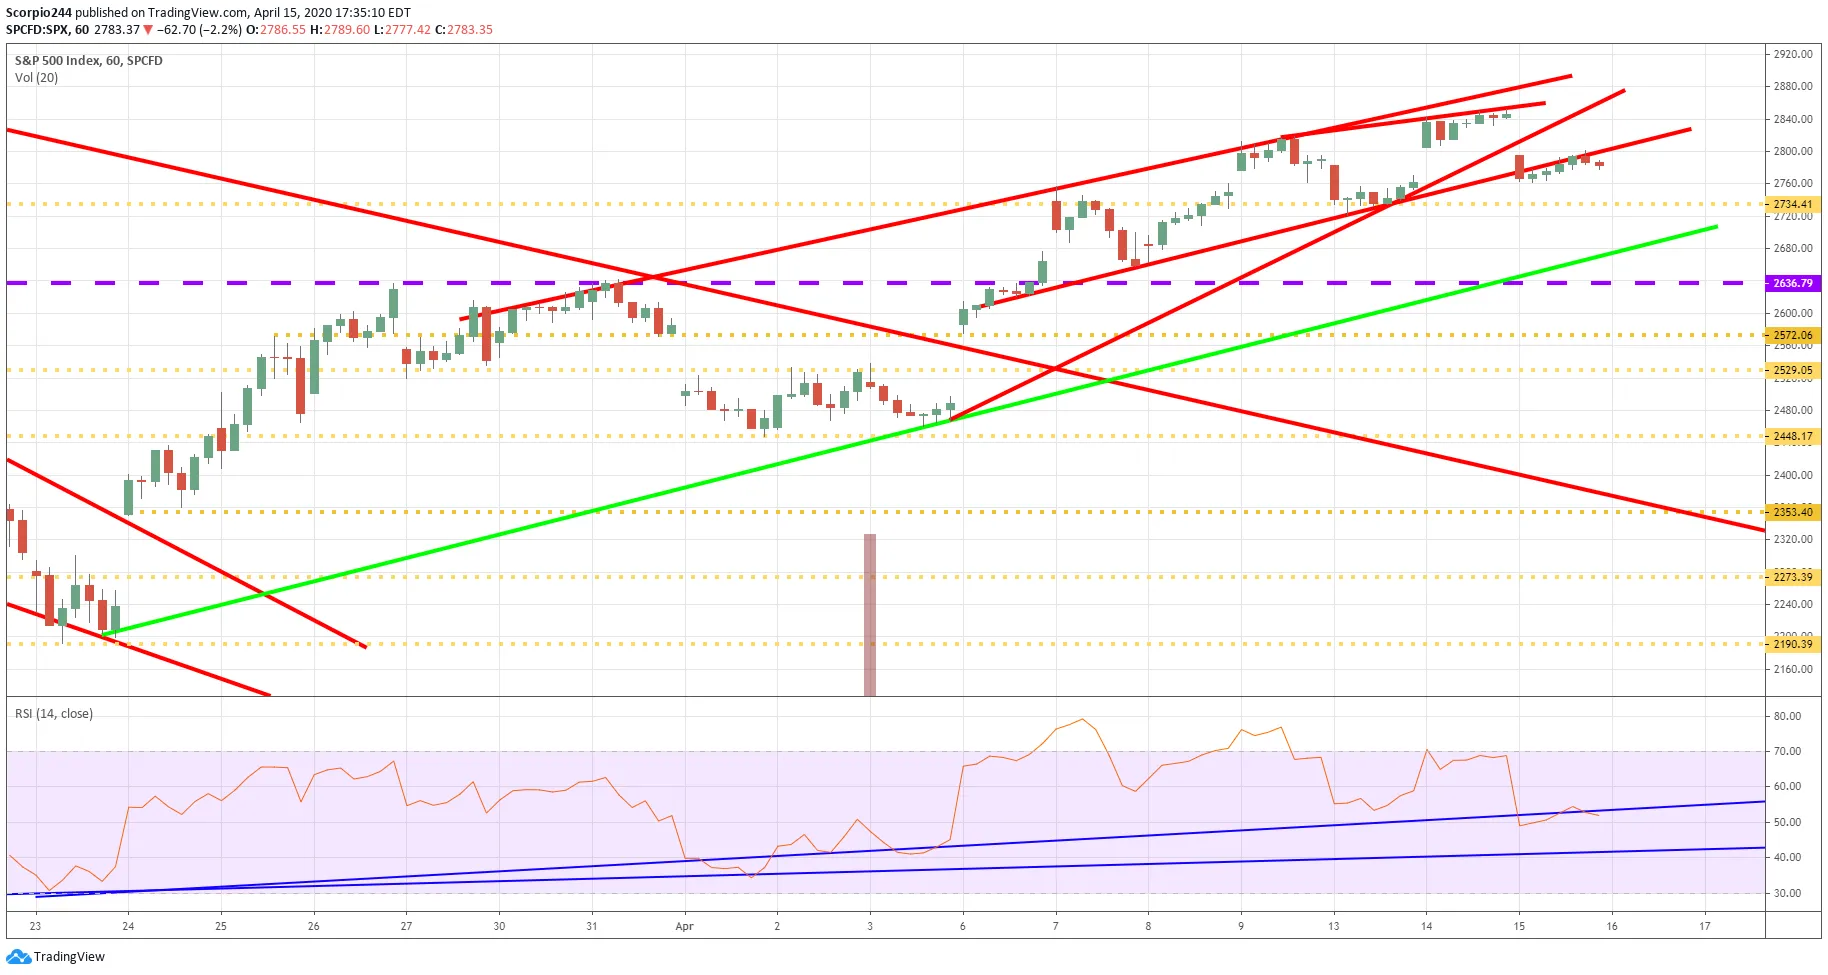
Anyway, I am moving on. The S&P 500 fell below the uptrend that had formed, and that may not be a good indicator of what is to come. It means the next level to watch out for on the S&P 500 is 2,735, and potential setting up a gap fill to 2,500.
Oil
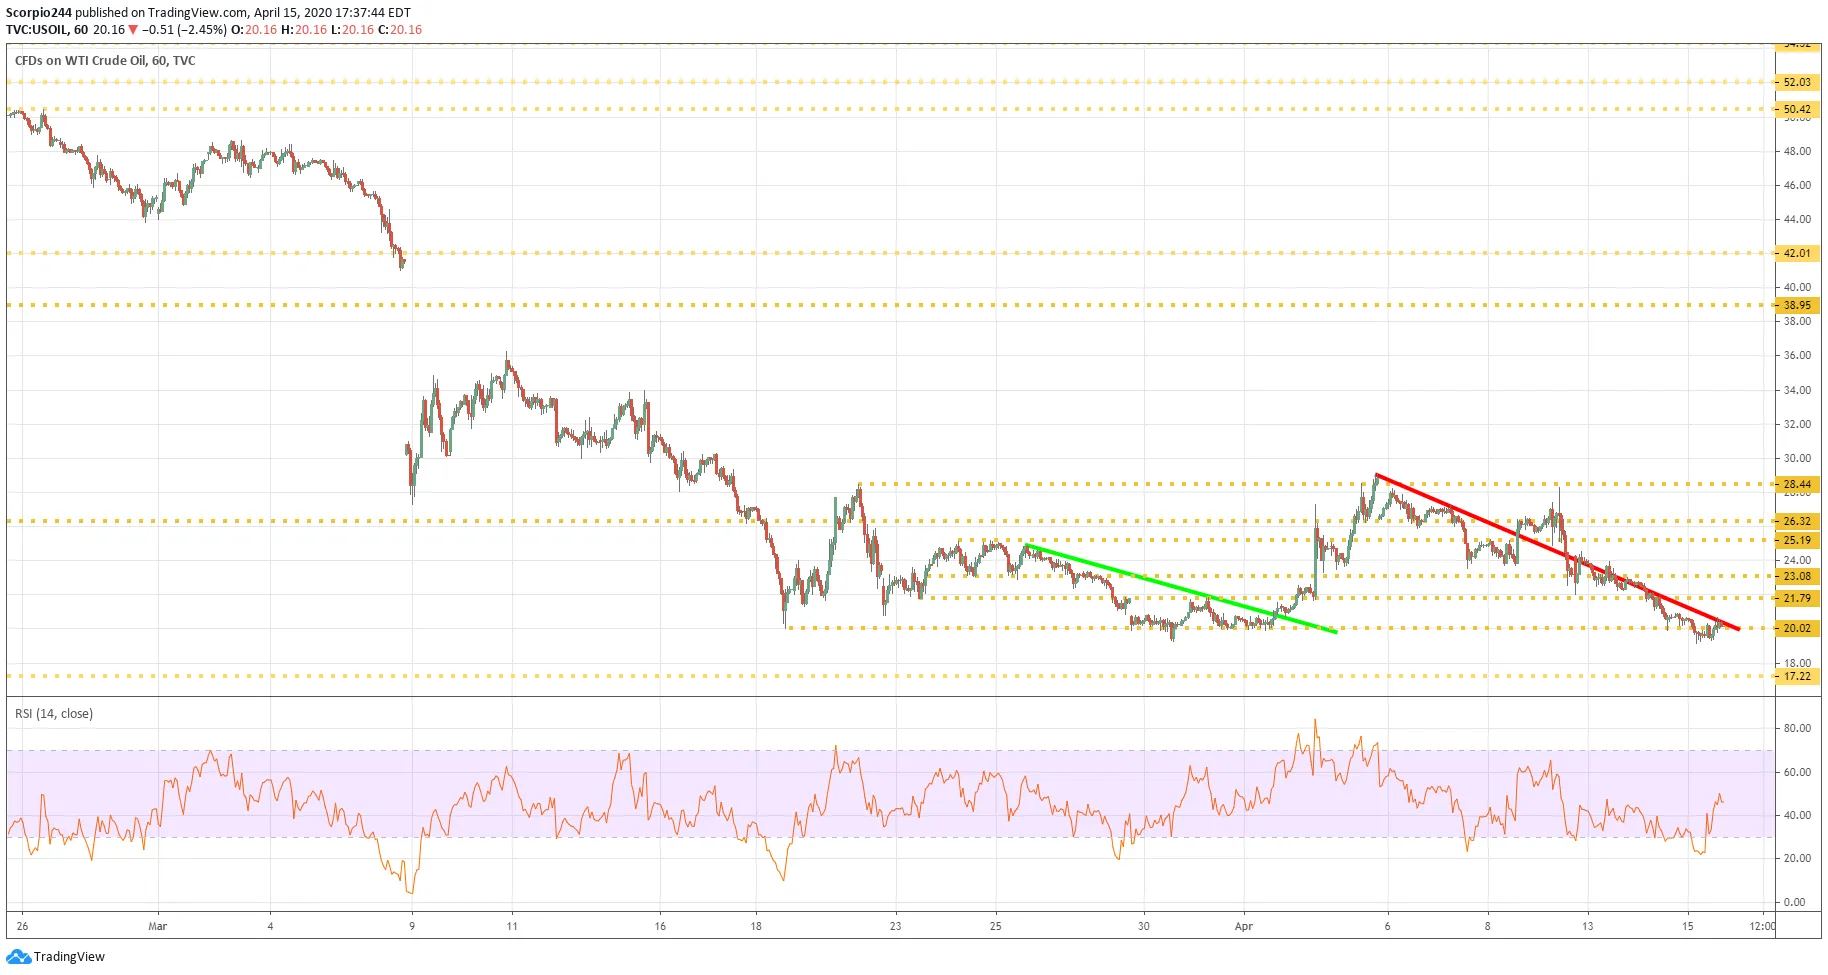
Oil prices just continue to fall, and this comes despite the production cuts. That is not a good sign. There is a real chance oil falls to $17.
Disney (DIS)
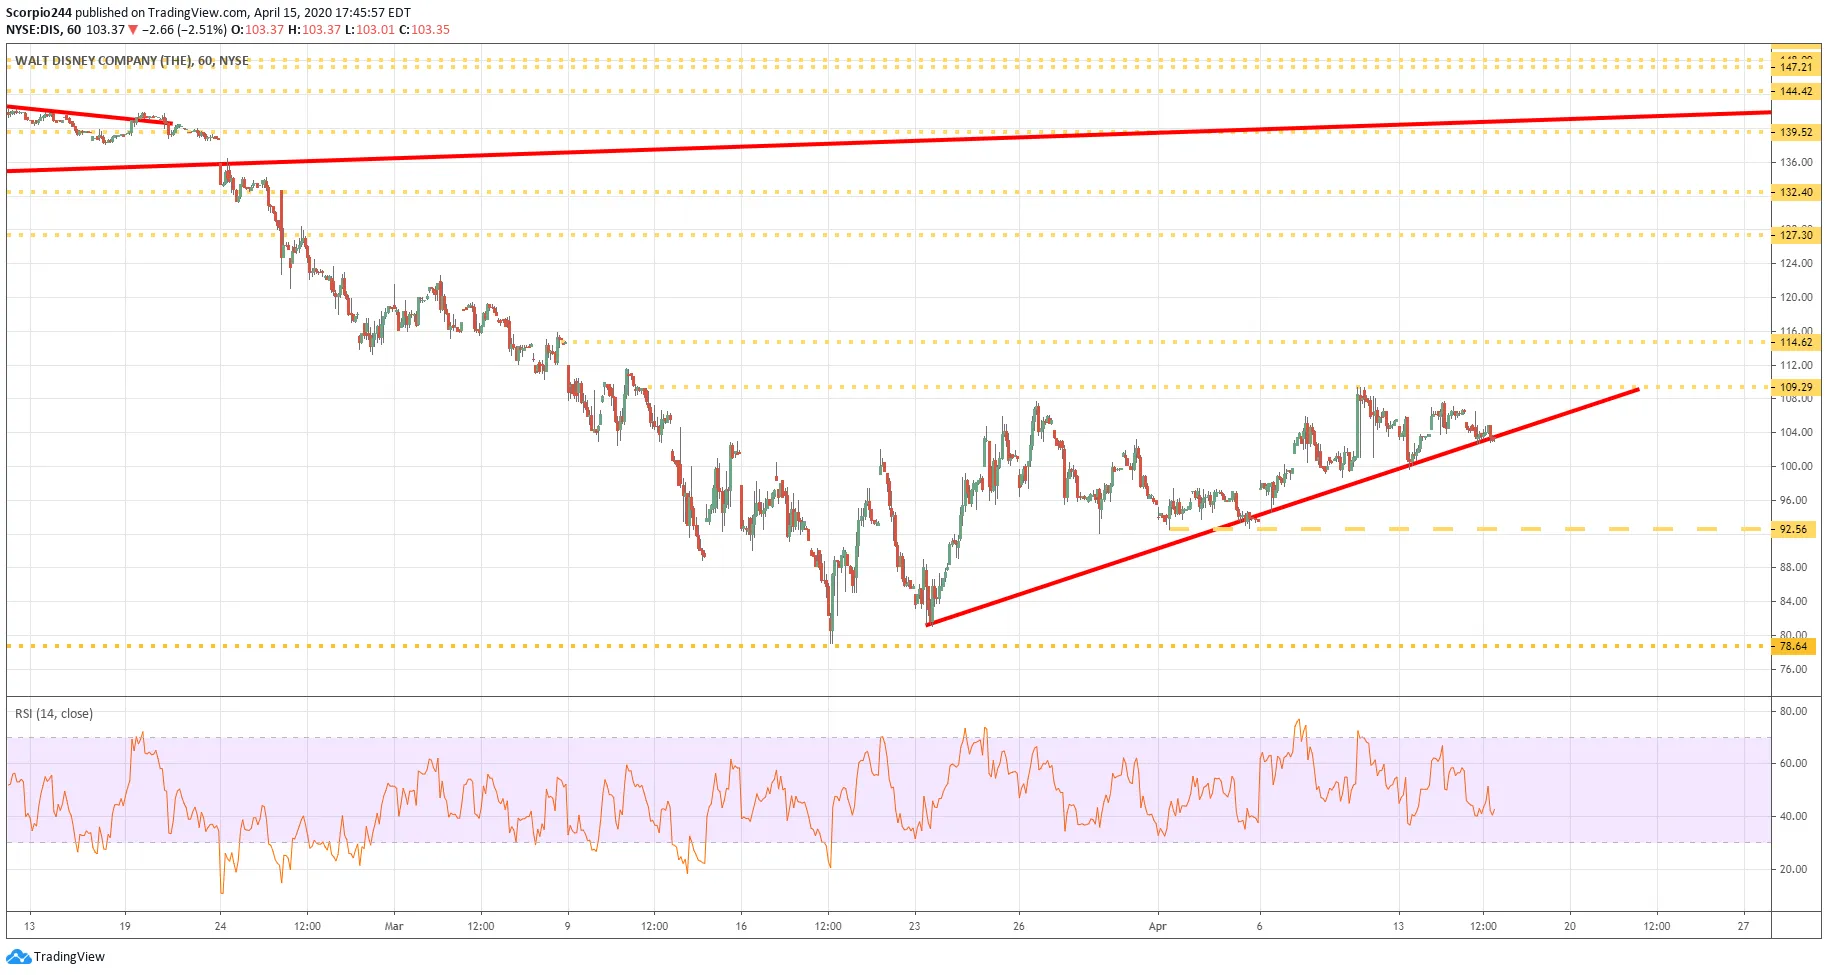
Regarding Disney, I noted yesterday that there were some bearish options betting recently. The stock finds itself sitting on support at $103 with a drop below the uptrend taking shares to its next level of support to $92.50. Disney’s stock faces further declines.
Roku (ROKU)
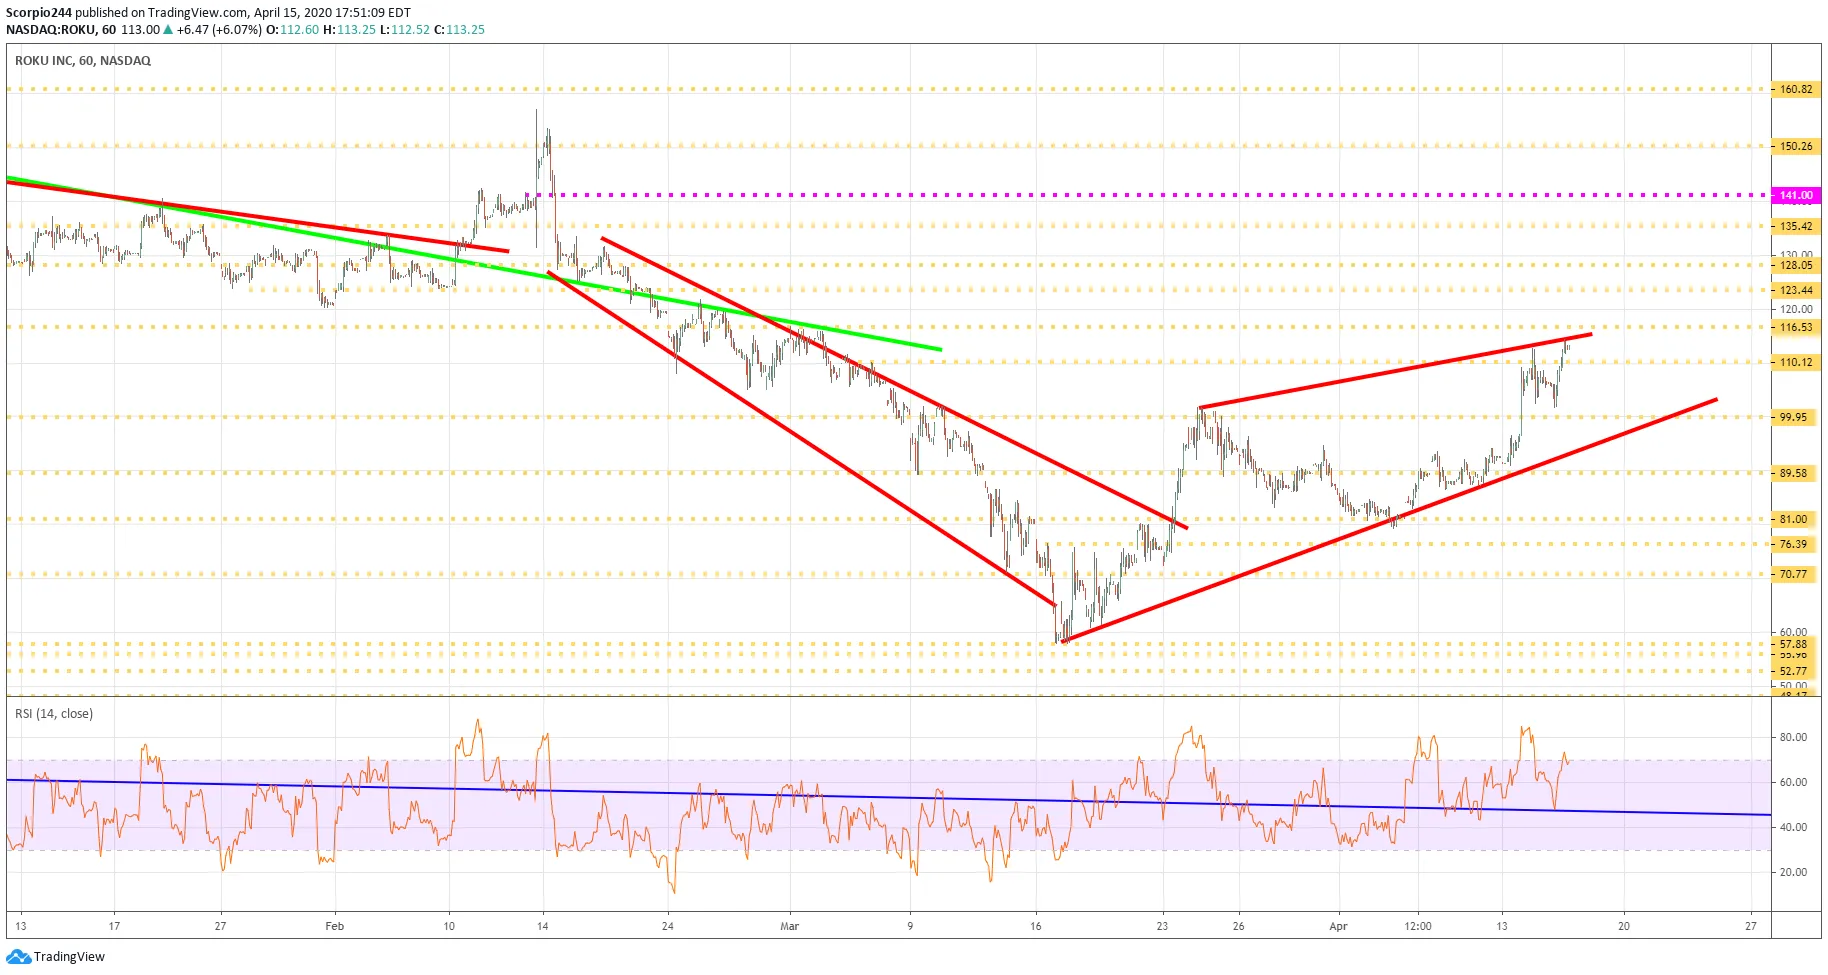
Roku (NASDAQ:ROKU) jumped yesterday. I wasn’t impressed by their pre-released earnings. You’d think with people being home more; you would have seen a more significant jump in their streaming hours, apparently not. Oh, I know it is because they instituted that new are you watching feature. Anyway, you can read more about Roku in this article I wrote for Forbes.
Western Digital (WDC)
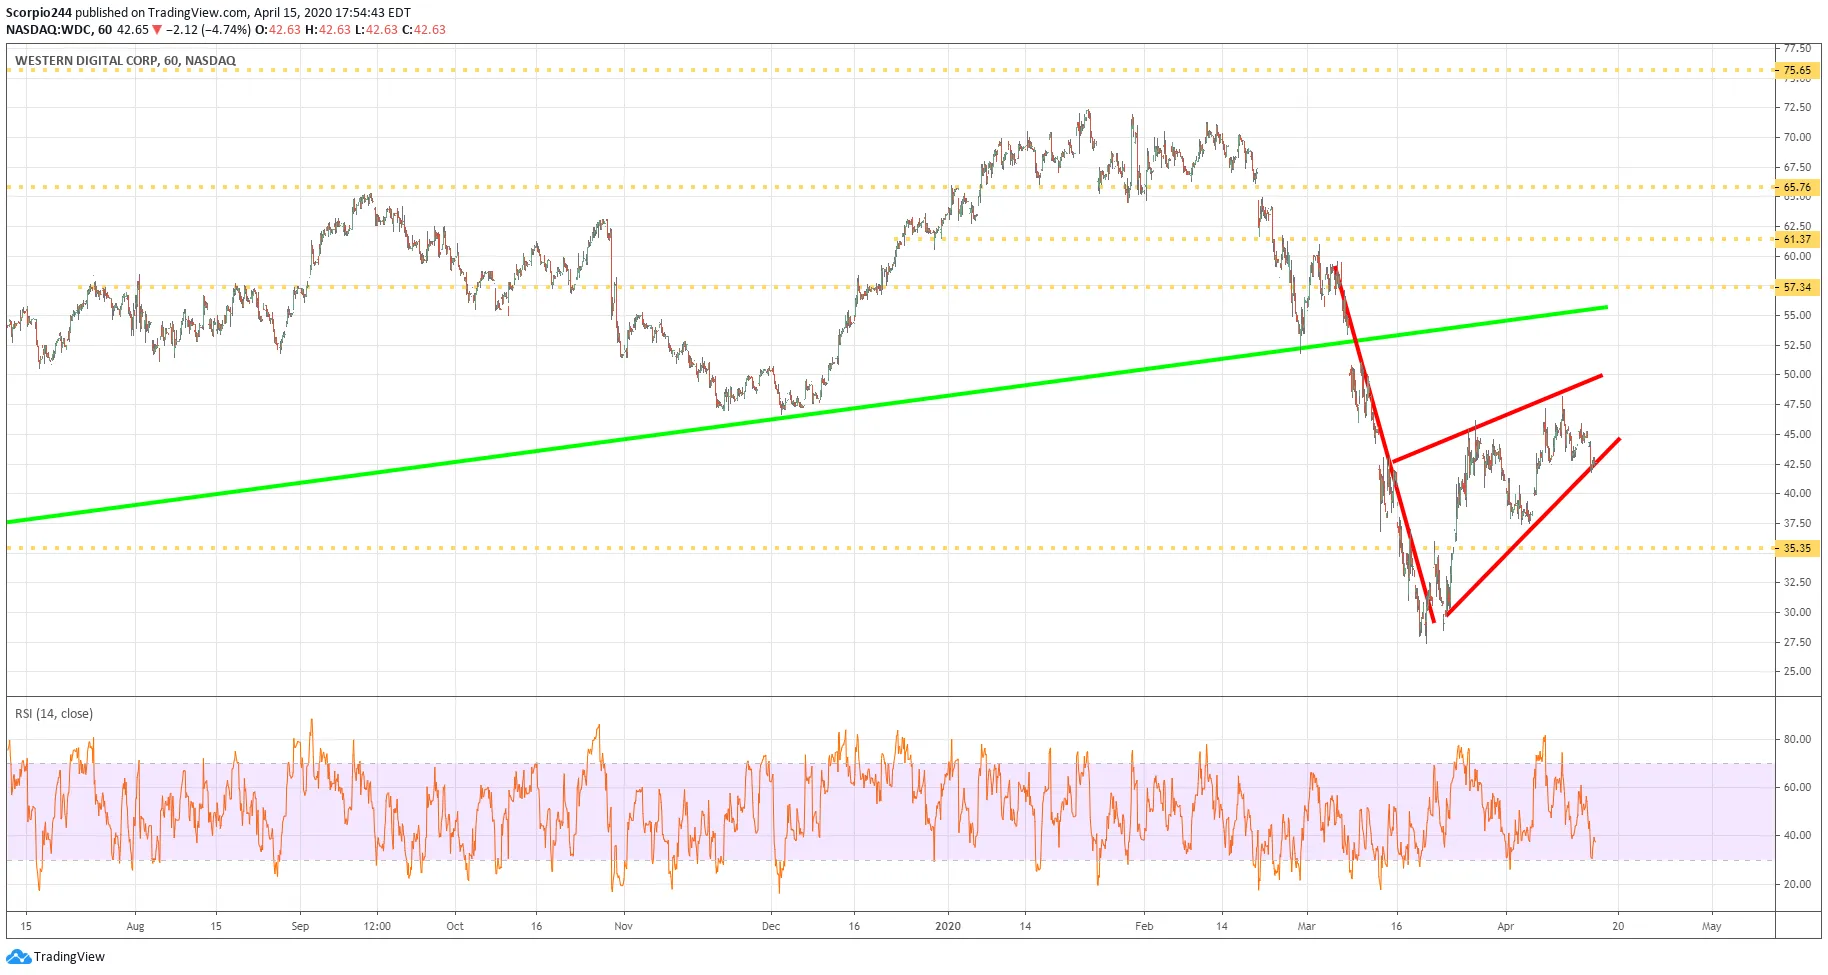
The technical pattern in Western Digital (NASDAQ:WDC) looks scary, kind of like a bear flag, $35.30 would be the level to look for.
ACADIA (ACAD)
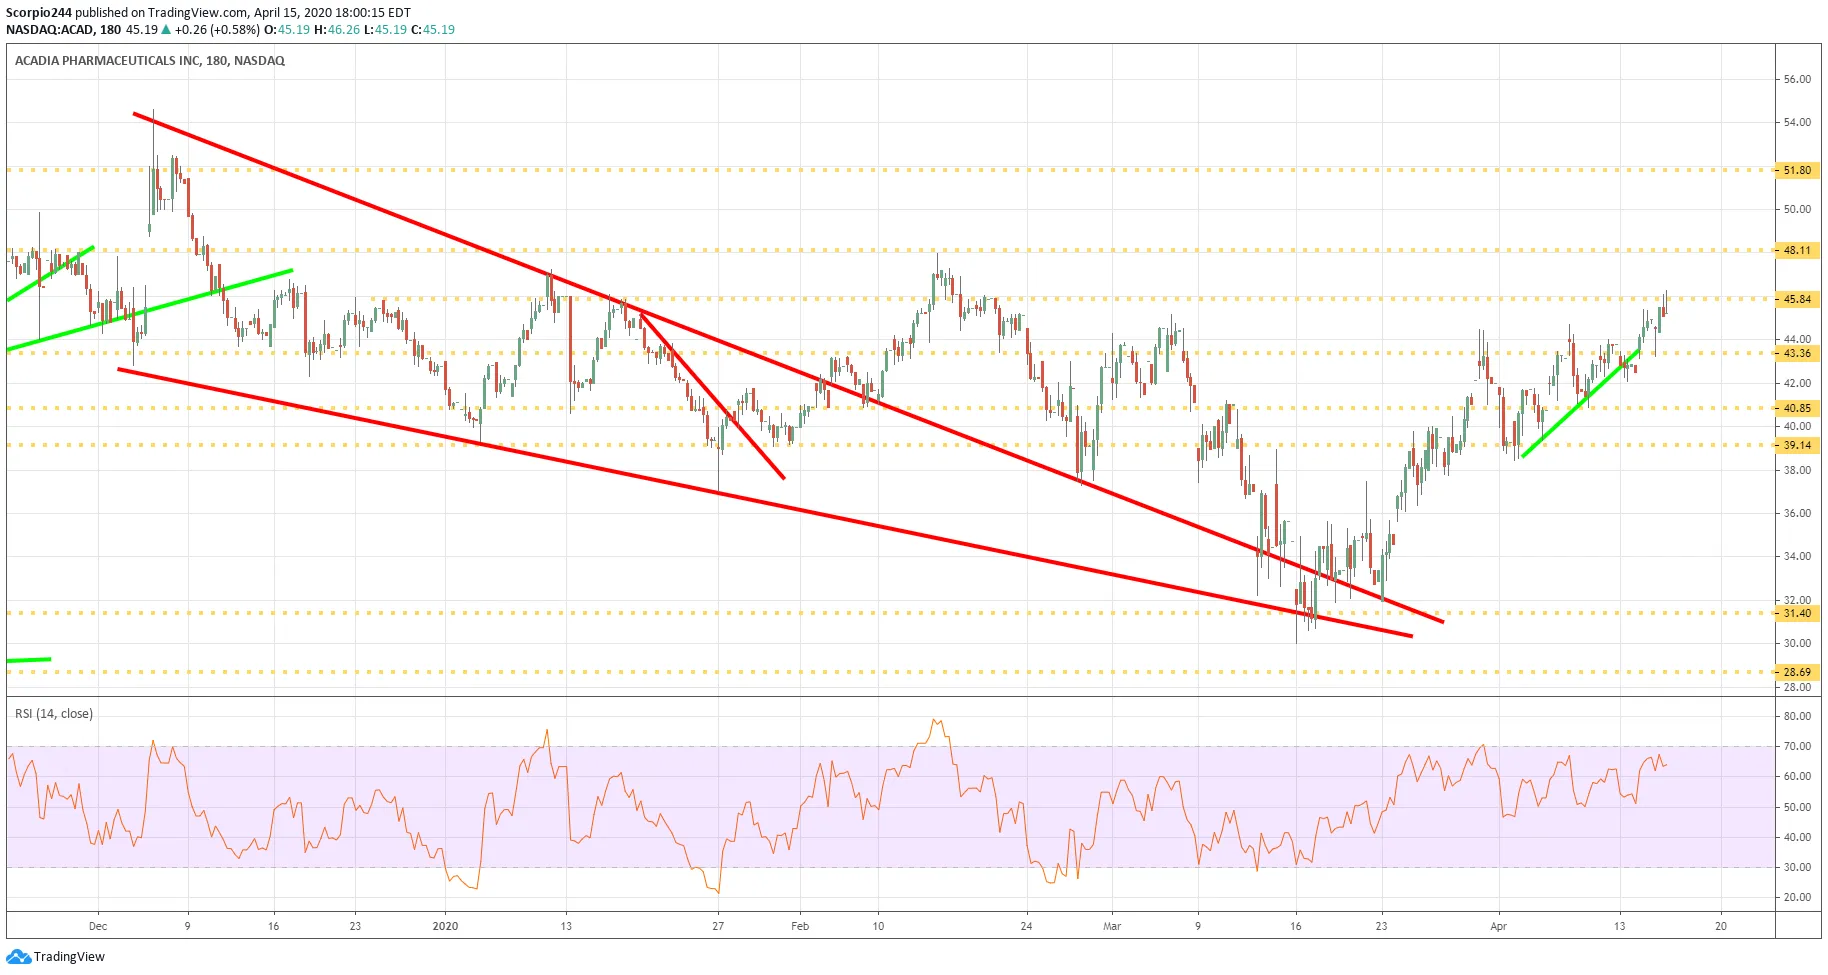
If ACADIA Pharmaceuticals (NASDAQ:ACAD) can clear $46, it could mean shares get back to $51.80. I say that $51.80 because it appears that a reverse head and shoulder patterns may have formed on the chart.
Johnson & Johnson (JNJ)
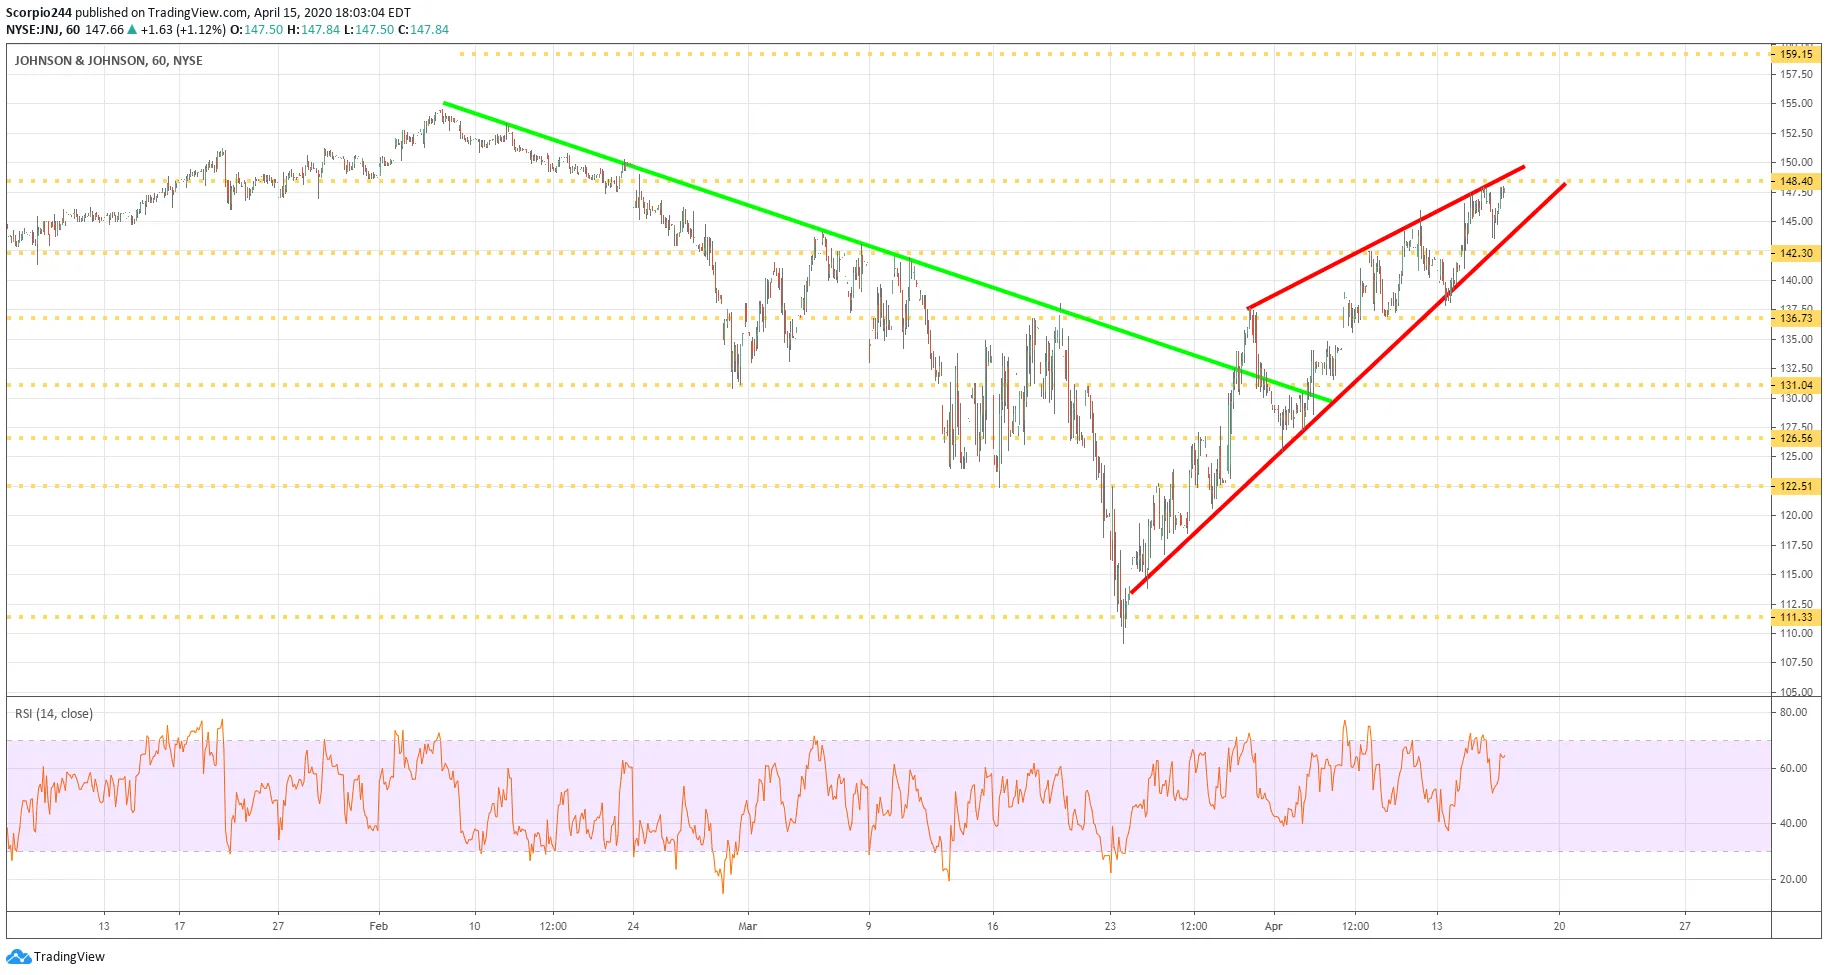
Johnson & Johnson (NYSE:JNJ) appear to have a rising wedge pattern, watch for a drop below $142.
