
Summary
While the one-week performance was bullish, the three-month performance table shows more defensiveness.
Relative performance tables also show an increasing defensiveness.
I look at the daily chart of each major sector ETF.
Let's start where we always do: a few tables of sector performance, starting at the one-week time frame:

There is good and bad news here. The good news is that the leading industries are not defensive. Consumer Discretionary led the pack, advancing .77% followed by technology, which was up .43%. The bad news is that only three sectors rose. Consumer Staples, which had been enjoying a decent run of late, fell 1.93%. Industrials also fell due to the continued increase in trade tensions. The same is true for basic materials.

The one-month performance numbers once again return to a more defensive posture. Health care is the top performer; utilities are third best. Financials are also doing well, but that's due to a very strong earnings season. The sector's chart is not bullish (see below). As the yield curve compresses due to the Fed's rate increases, so does financial institutions' interest rate margins, and hence, their profits. Don't expect this performance to last. Crude Oil's recent weakness is obviously hurting the energy sector.
And finally, we have the three-month time frame table:

This is where the recent conservative nature of the market is taking shape. Healthcare and consumer staples stocks are leading the pack strongly. Consumer discretionary is third which is followed by another conservative sector: utilities.
But it's on the relative strength chart and table that the market's newfound love of defensive investments really shows:
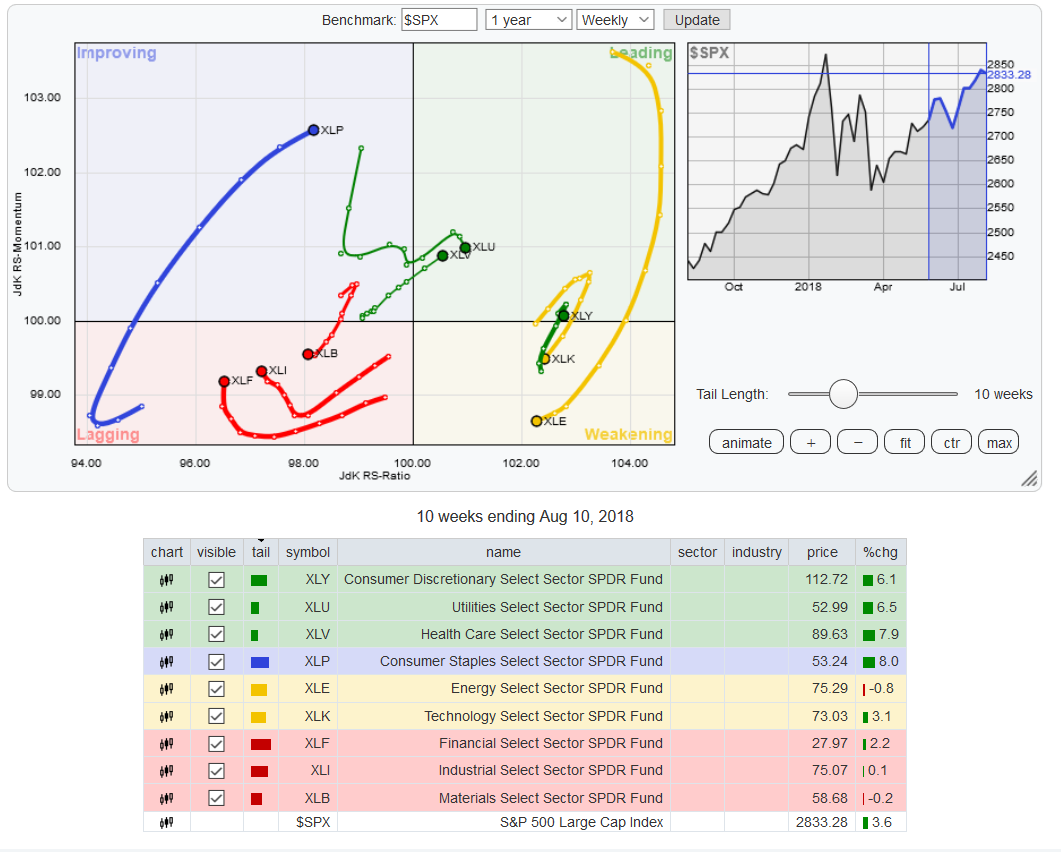
Utilities and healthcare stocks are outperforming the broader index. Consumer discretionary is just barely hanging on. Consumer staples are improving. Industrials and basic materials - which are taking it in the financial teeth as a result of the trade war - are lagging. Financials are also in this category.
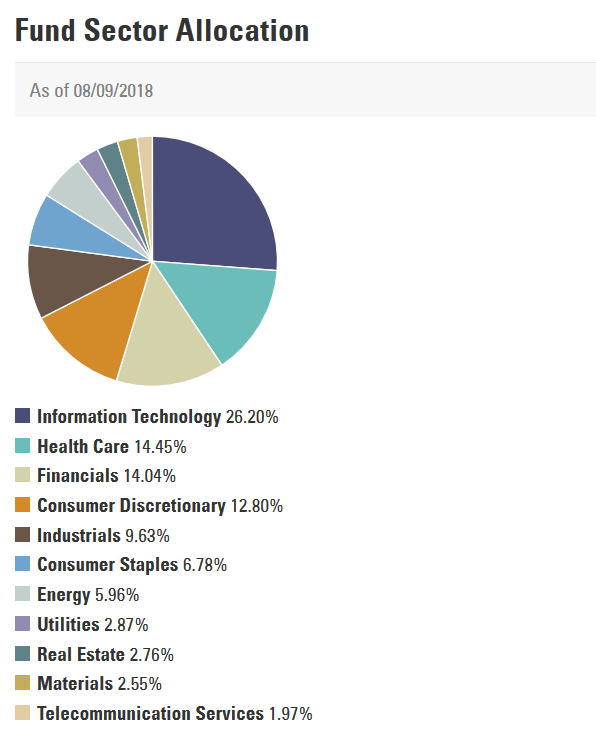
This week, I'm going to look at the daily charts of the nine major sector ETFs in their order of importance to the SPDR S&P 500 (NYSE:SPY), which are contained in this table and pie graph:
Technology (XLK)

This ETF is still in an uptrend, with a trend line that connects four lows from the ETF's spring rally. While the ETF is bullish (all are rising; the shorter are above the longer; prices are using the ETF for technical support) momentum is weakening.
Healthcare (XLV)

There is lots of good news here. Momentum is solidly increasing; it's been rising since early April. Prices were in a very strong uptrend that rose through resistance in the mid-80s. However, prices closed below the trend line on Friday as they approached their 52-week high. This isn't fatal; it's not uncommon for prices to briefly move below major trend lines during long advances. The key is the adverb "briefly." For the uptrend to continue, prices need to return to their bullishness soon - as in, next week.
Financials (XLF)

This chart is another reason I'm unenthusiastic about the financial sector: prices have been moving sideways since mid-March, using the 200-day EMA for technical support. As we're late in the financial cycle, I wouldn't expect this trend to change.
Consumer Discretionary (XLY)

This chart is still bullish. Prices are above recent highs around the 108 level. They're also consolidating in an upward sloping wedge pattern. The positive macroeconomic environment - low unemployment, rising wages, higher consumer confidence - supports a continued uptrend. Also remember that we're entering the last half of the year which means holiday shopping.
Industrials (XLI)

Like the financial sector ETF, industrials are trending sideways, using the 200-day EMA's technical support. The MACD recently gave a sell signal, which, when combined with the tariff situation, will probably send prices lower (again).
Consumer Staples (XLP)

Prices were in an uptrend until this week. Prices closed out the week at the 50-day EMA with the MACD giving a sell signal. A pullback to the 200-day EMA wouldn't be surprising considering this ETF's recent performance.
Energy (XLE)

After rallying strongly in the spring, prices have consolidated at the top of their 52-week range. They are currently trending sideways. This sector is largely dependent on oil prices, which are currently in a lull. However, keep an eye on the Iran situation, which could create an increase in oil prices in the fall.
Utilities (XLU)

This ETF was in a strong uptrend in June. It has since been consolidating its gains in an upward sloping wedge pattern.
Basic Materials (XLB)

This sector is right at the 200-day EMA. Yes, it's technically in an uptrend. But considering the poor macroeconomic backdrop (read: trade war), this sector is a lost cause right now. Plus, we're nearing the end of this expansion, which is the worst time to invest in this sector.
Let's place all of this information into a group of charts:
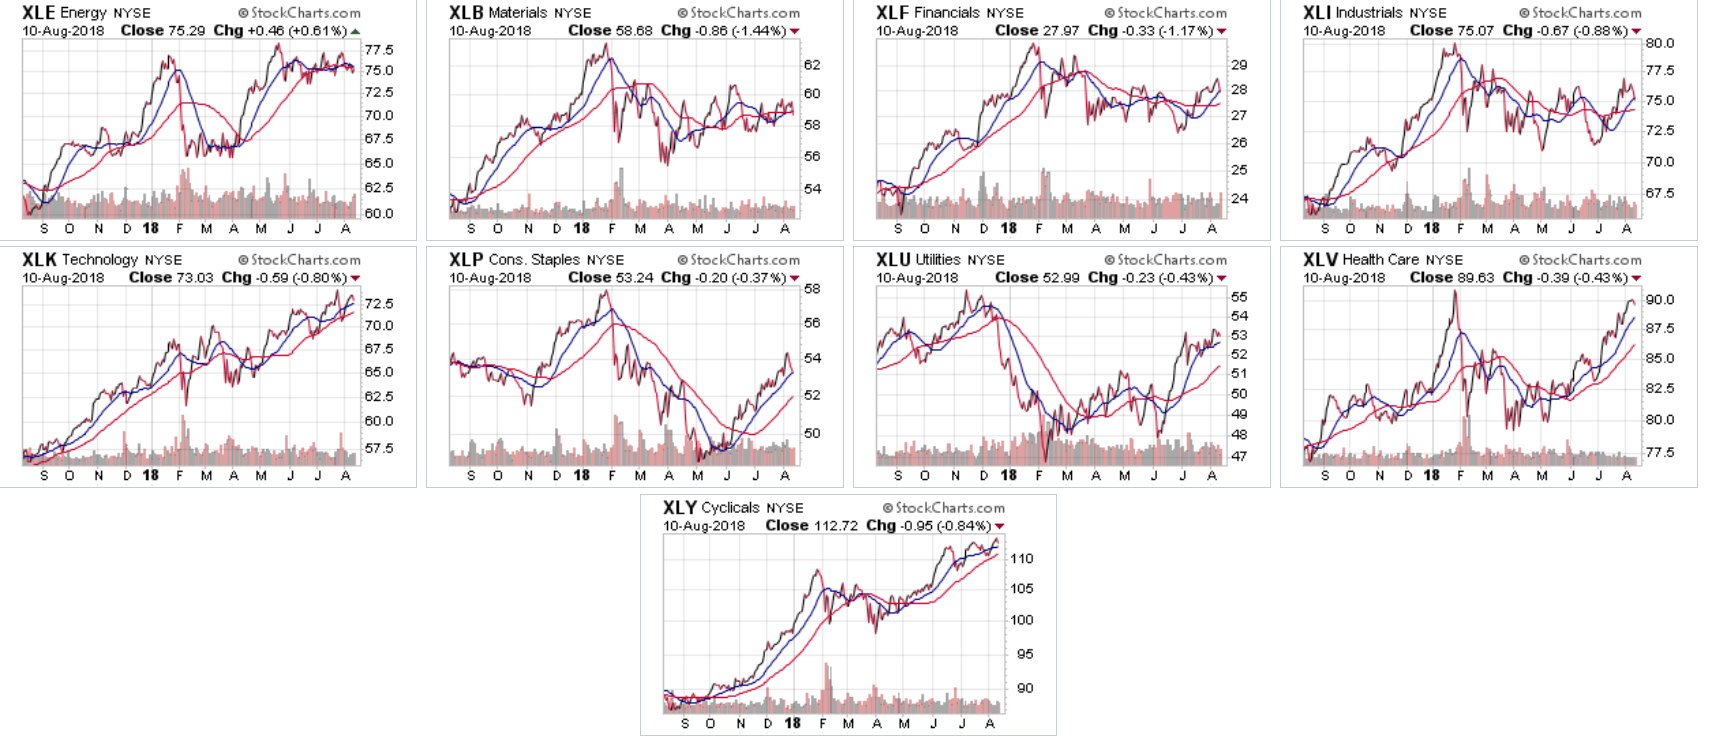
Four charts in a solid uptrend: technology (second row, far left), staples (second row, second from left), healthcare (second row, far right), and discretionary (bottom). Utilities (second row, second from right) are also doing well. Notice that three of these sectors - utilities, staples, and healthcare - are defensive.
Disclosure: I/we have no positions in any stocks mentioned, and no plans to initiate any positions within the next 72 hours.
I wrote this article myself, and it expresses my own opinions. I am not receiving compensation for it (other than from Seeking Alpha). I have no business relationship with any company whose stock is mentioned in this article.