Gold and silver hit fresh record prices on rate-cut hopes, geopolitics
Elite covered call writers understand the importance of position management in maximizing returns. As a result, I receive a significant number of inquiries regarding exit strategy execution. This article will highlight one such question I received from John, which has two components to it. The main item relates to rolling-out-and-up, a frequently-used exit strategy in our arsenal. The second aspect of John’s question I will address first because it caught my attention and I needed to get an answer before I addressed the main issue of rolling options. Here’s John’s question See if you can find my mathematical concern:
John’s question
I own 300 shares of FIVE (NASDAQ:FIVE) at $40.26 and sold the $38.00 call for a net of $434.00 for the three contracts. FIVE is now trading at $43.99 and wondering if I am better off being assigned or rolling out-and-up to the $44.00 strike for a net premium of $510.00 ($170.00 per contract). The cost-to-close is $670.00 per contract. I am bullish on the stock. Can you help?
Why does the math seem erroneous?
Did you find why I am puzzled? It’s in the very first sentence of John’s question. With share price at $40.26, the $38.00 strike is $2.26 in-the-money meaning that every option contract sold will have $226.00 of intrinsic value plus a time value component. That computes to $678.00 plus time value. However, John received only $434.00. The math tells us a story. John bought FIVE for $40.26 but didn’t sell the call at the same time. He waited and watched share value decline and then sold the option…had to be. Yes, this was confirmed by John.
Should we roll out-and-up?
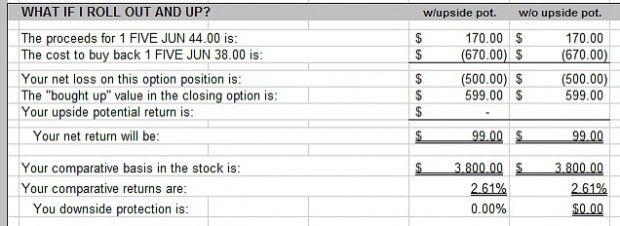
This aspect is made easy by using the “What Now” tab of the Ellman Calculator:

The results of the spreadsheet calculations show a 1-month return of 2.61% for this at-the-money strike. This means no chance of upside potential and no downside protection of the 2.61%. The breakeven is at $43.00. These calculations are based on the prices at the time John entered the covered call trade initially, not after he bought the shares at a higher price.
Discussion
Exit strategies are critical to covered call writing and so members like John are on the right track examining rolling options and other choices. When we buy a stock specifically for covered call writing, it is best to sell the call option immediately after executing the long stock trade. There are times, of course, when the stock was already in our portfolio with a higher or lower cost basis than current market value. However, our trade decisions are always based on current stats and we should not be influenced by what happened in the past.
Market tone
Thanks to a surge the last two months of the year, the S&P 500 ended up 9.32% for 2016. This is within the historical average for the stock market. The CBOE Volatility Index moved up slightly to 14.05, still at historical lows. This week’s reports and international news of importance:
- Business confidence in Russia sank even further into negative territory in December, reaching -8 from -7 in November
- Global business sentiment ended 2016 on a solid note. Confidence remains firm and consistent with an economy expanding at the high end of its growth potential
- France has experienced the third drop in joblessness in a row
- Japan’s labor force is approaching full employment, despite wages not growing rapidly. The seasonally adjusted unemployment rate was 3.1% in November, up from 3% in the prior month. Housing starts rose 6.7% y/y in November. Both industrial production and retail sales ticked up in December
- The Case-Shiller US house price index extended its October run as rising home sales pushed house prices higher. The 20-city composite index increased 5.1% on a year-ago basis in October, up 0.1% from the month prior
- The Conference Board Consumer Confidence Index rose 4.3 points in December to 113.7, its highest level since 2001
- Potential US home sales took a dip in November, plunging 2.5% on a seasonally adjusted basis to 107.3, defying expectations of a 0.3% increase
- US wholesale inventories soared in November, putting the fourth quarter inventory build back on track. The November advance estimates show a 0.9% increase, following a revised 0.1% drop in October
- Trade will likely be a drag on fourth quarter GDP growth, as November’s advance trade numbers showed a trade deficit of $65.3 billion in November
- Initial jobless claims fell 10,000 to 265,000 in the week ending December 24th. This was in line with consensus expectations, and the prior week was unrevised at 275,000
THE WEEK AHEAD
- Tues. Jan. 3rd: ISM manufacturing and construction spending
- Wed. Jan.4th: Motor vehicle sales
- Thurs. Jan. 4th: Weekly jobless claims and ISM non-manufacturing
- Fri. Jan. 6th: Non-farm payrolls, unemployment rate, hourly earnings, foreign trade balance and factory orders
For the week, the S&P 500 declined by 1.31% for a year-to-date return of +9.32%.
Summary
IBD: Market in confirmed uptrend
GMI: 6/6- Buy signal since market close of November 10, 2016
BCI: I am currently fully invested and have an equal number of in-the-money and out-of-the-money strikes. I would like to see more specificity regarding domestic and global policies for the new administration before taking a more bullish stance.
WHAT THE BROAD MARKET INDICATORS (S&P 500 AND VIX) ARE TELLING US
The 6-month charts point to a cautiously bullish outlook. In the past six months, the S&P 500 was up 6% while the VIX (11.44) declined by 10%.
