
Slicing and dicing the US equity market into factor buckets is, at its core, an effort to enhance return by engineering more control over risk management. A key part of this framework is recognizing that risk and return for the stock market overall is a byproduct of multiple factors, such as shares trading at low valuations or posting strong price momentum in the recent past. In turn, it’s reasonable to assume that a set of factor ETFs will exhibit relatively low correlations with one another, offering a degree of diversification otherwise unavailable via standard portfolio designs for capturing equity beta. To test that assumption, let’s review the return correlations for a broad set of factor ETFs in recent history.
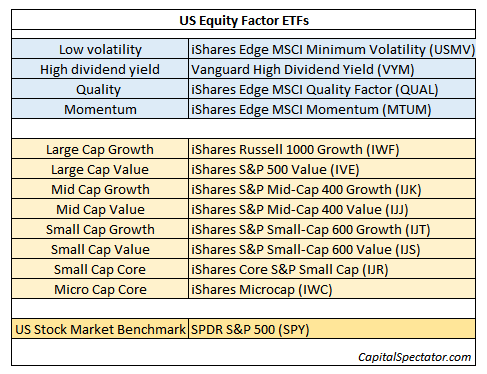
For this test we’ll review numbers for a dozen factor ETFs plus a proxy for the broad market beta:
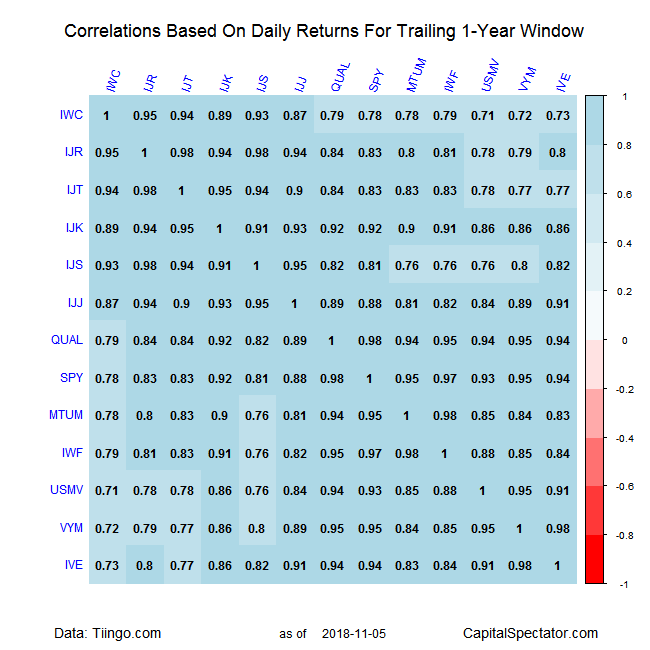
Let’s start by looking at daily returns for the past 12 months (through yesterday’s close, Nov. 5). As the table below shows, the main result is that correlations are generally quite high (roughly 0.7 and higher) relative to the market overall, as proxied by SPDR S&P 500 (NYSE:SPY). That’s a clue for thinking that the diversification benefits from factor ETFs may be lighter than the marketing brochures for these funds imply.
The lowest correlation for the trailing one-year period is 0.71 for momentum (USMV) and micro-cap (IWC). That’s far enough below 1.0 (perfect positive correlation) to offer diversification benefits but it pales next to stock/bond correlations that are closer to 0.0, much less the absence of correlation or negative correlation readings.
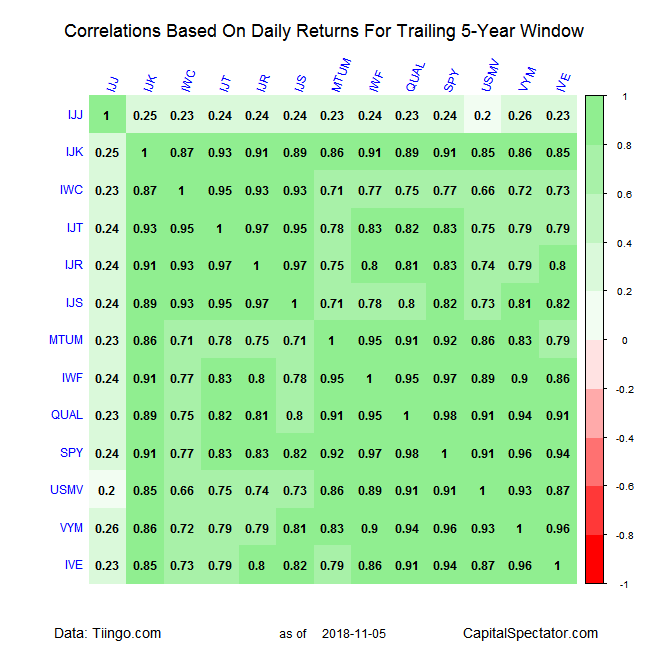
But let’s not be too hasty. A closer look offers a more nuanced profile when comparing factor ETFs to one another and at different time periods and return frequencies. If we extend the trailing period to the past five years for daily returns, for instance, the correlations fall further for equity factors, although primarily for pairings with mid-cap value stocks. Indeed, as the next chart below shows, iShares S&P Mid-Cap 400 Value (IJJ) reflects correlations of roughly 0.2 to 0.3 vs. the rest of the field – far below the other pairings. What’s going on with mid-cap value stocks? Unclear, but it’s an area that’s worthy of deeper study. The main question: Are the low correlations with mid-cap value recurring or specific to the past five-year period?
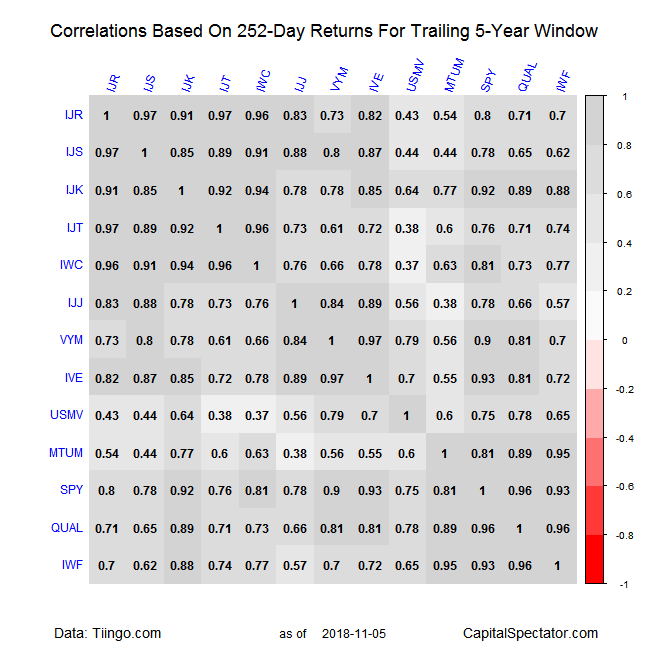
Finally, consider how correlations for rolling one-year returns compare. By this measure there’s a wider range of readings vs. daily returns. For example, low volatility (USMV) shares low correlations (below 0.4) with small-cap growth (IJT) and micro-cap (IWC). A similarly low-correlation profile applies to momentum (MTUM) and mid-cap value (IJJ).
The numbers above tell us that factor ETFs offer a fair amount of diversification benefits, albeit with limits. Surprising? Not really. You can’t get blood out of a stone or consistently low/negative correlations by slicing up the US equity bucket into smaller pieces. Stocks, after all, are still stocks and will usually exhibit a higher degree of market beta.
That said, the diversification opportunities that do exist with factor ETFs are compelling, if only when compared to the usual suspects. There are no silver bullets here, but a carefully designed and managed equity portfolio comprised of factor ETFs may provide marginally improved risk and return benefits vs. a conventional approach to investing in US equity beta.