Yellen seems to me to be mastering the art of saying things so that everyone can come away hearing what they wanted to hear.
For those concerned about the Fed leaving interest rates too low for too long, she adopted a hawkish view on the economy, particularly when it comes to the payrolls. For those thinking that any Fed rate hike would send the Dollar soaring, pressuring Emerging Markets as well as equity markets both here domestically and elsewhere, she sounded the theme of interest rates remaining low for a long time. Thus, if the Fed were to hike sooner rather than later, no need to worry because it would not signal the beginning of a rapid series of rate hikes.
Initially, everyone seemed happy – Utility stocks moved higher but so did banking stocks/financials. By the end of the day, the utility sector had sold off and banks faded somewhat. Emerging Markets which initially were more than happy, then faded sharply before the closing bell rang.
The dollar, which had initially moved higher moments after the speech, then reversed and sold off, managed to reverse its reversal and ended higher on the day.
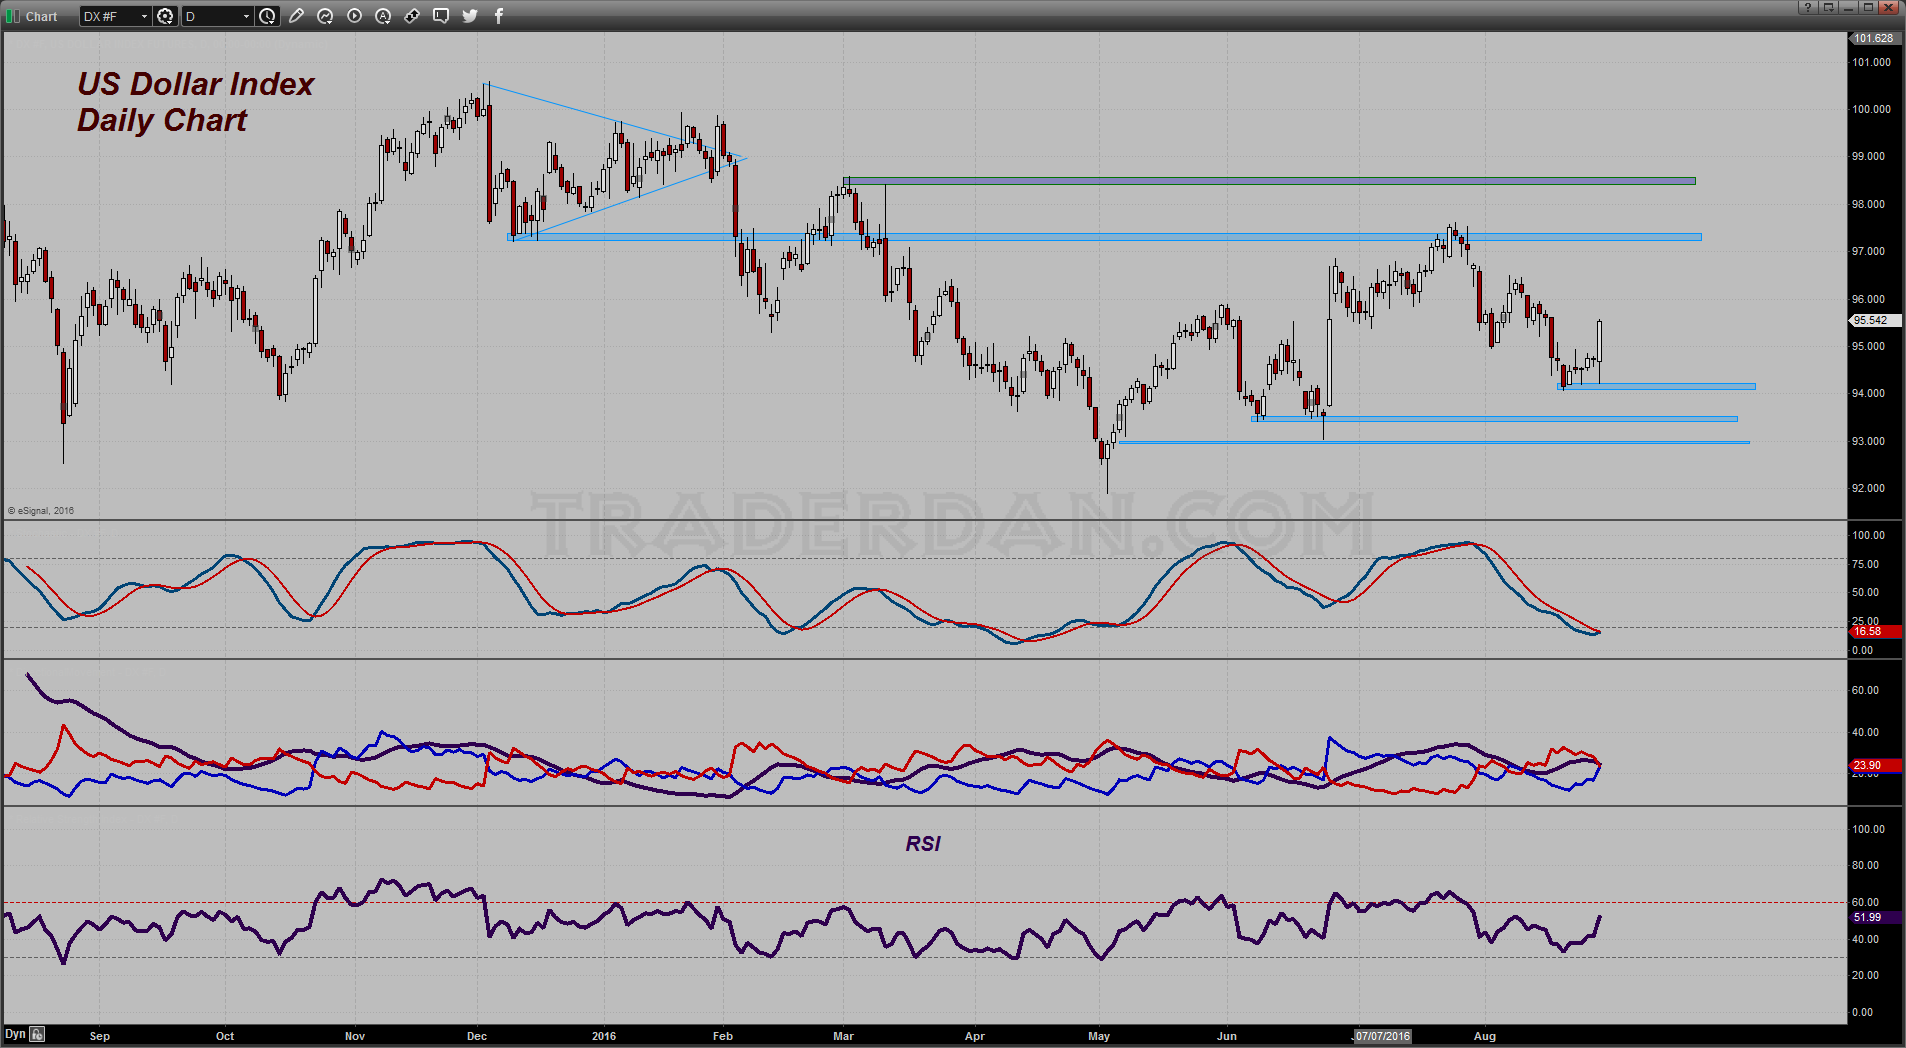
So far the 94 level in the USDX seems pretty solid. Now we need to see if we are going to get more upside. The next level that offers some minor resistance is near 96 and then again at 96.50. Stronger resistance is up near 97.00-97.25.
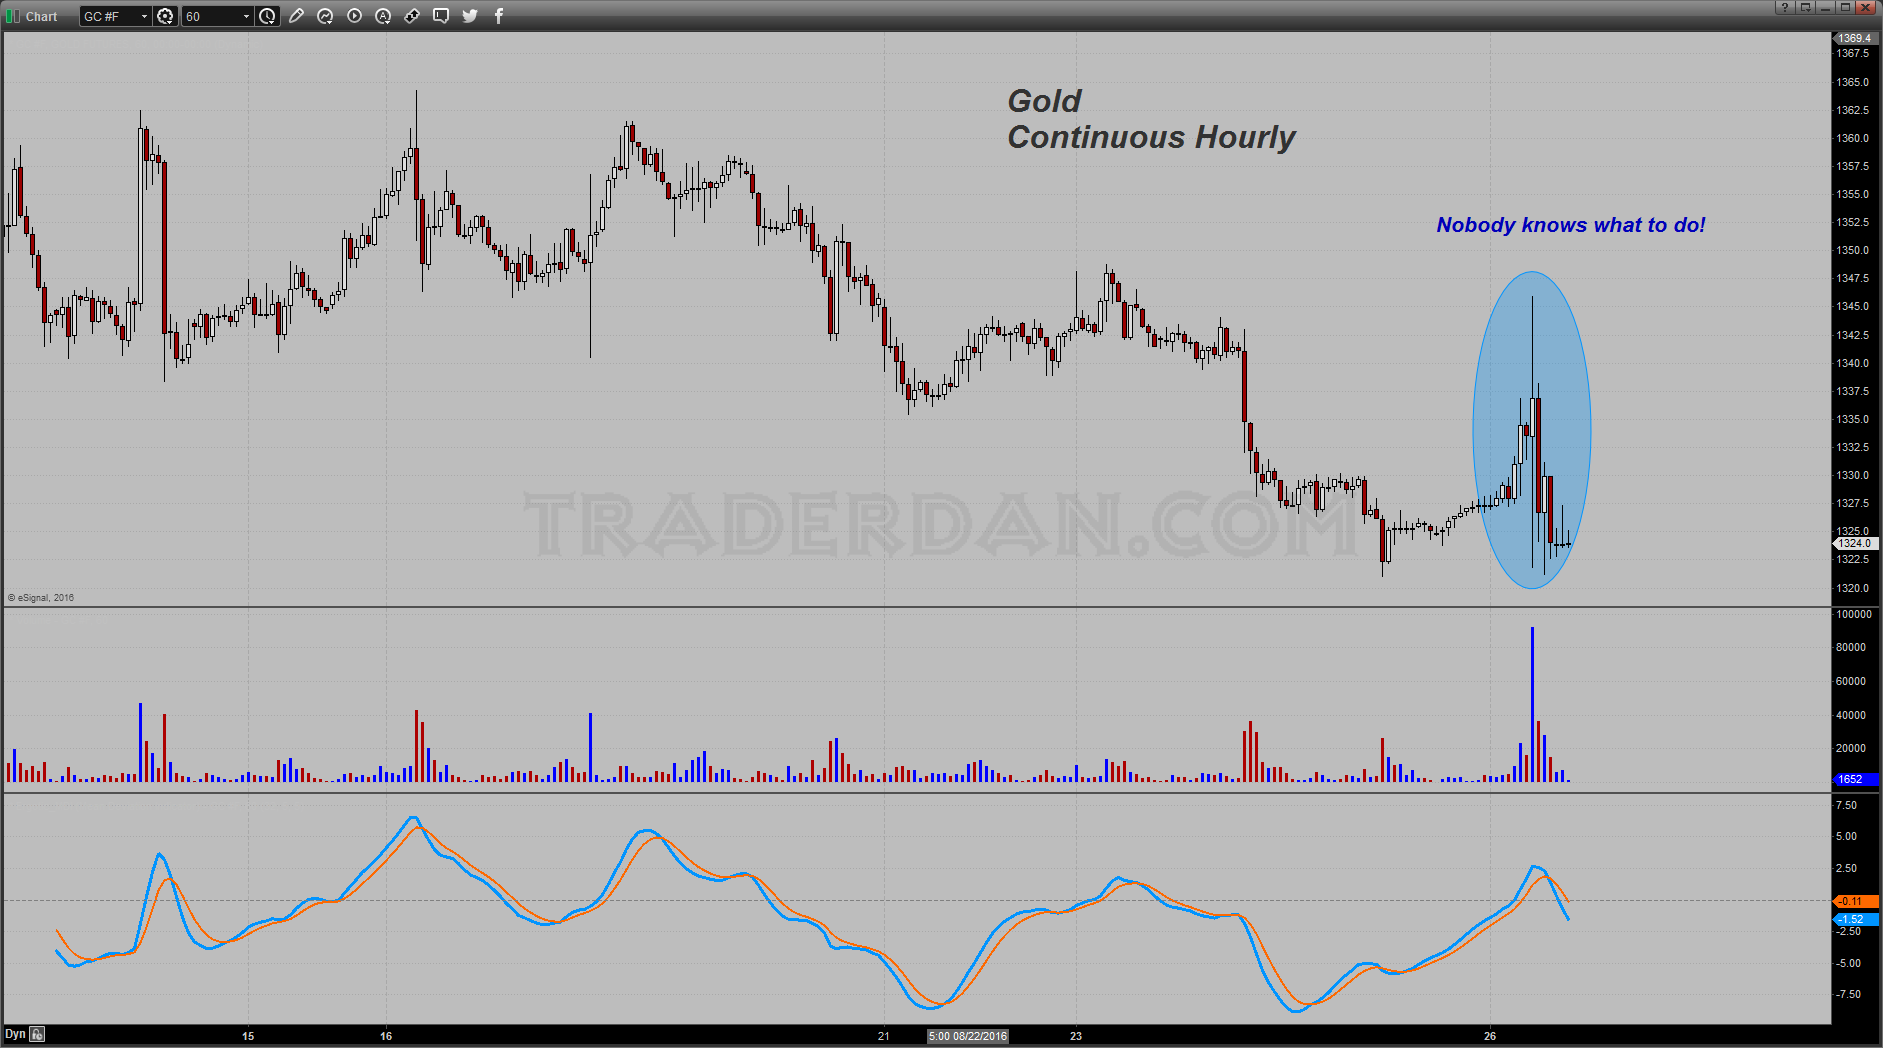
The same sort of confusion that gripped most major markets was seen in the gold market which was all over the place yesterday ( Friday).
Look at this hourly chart of gold.. talk about whipsawing back and forth! You had a $25 range within the span of an hour before the market finally succumbed to the move higher in the US Dollar. Look at the volume spike – an awful lot of people got hurt going either direction on Friday.
On the daily chart, the market still remains locked within the broad trading range that has held it since last June.
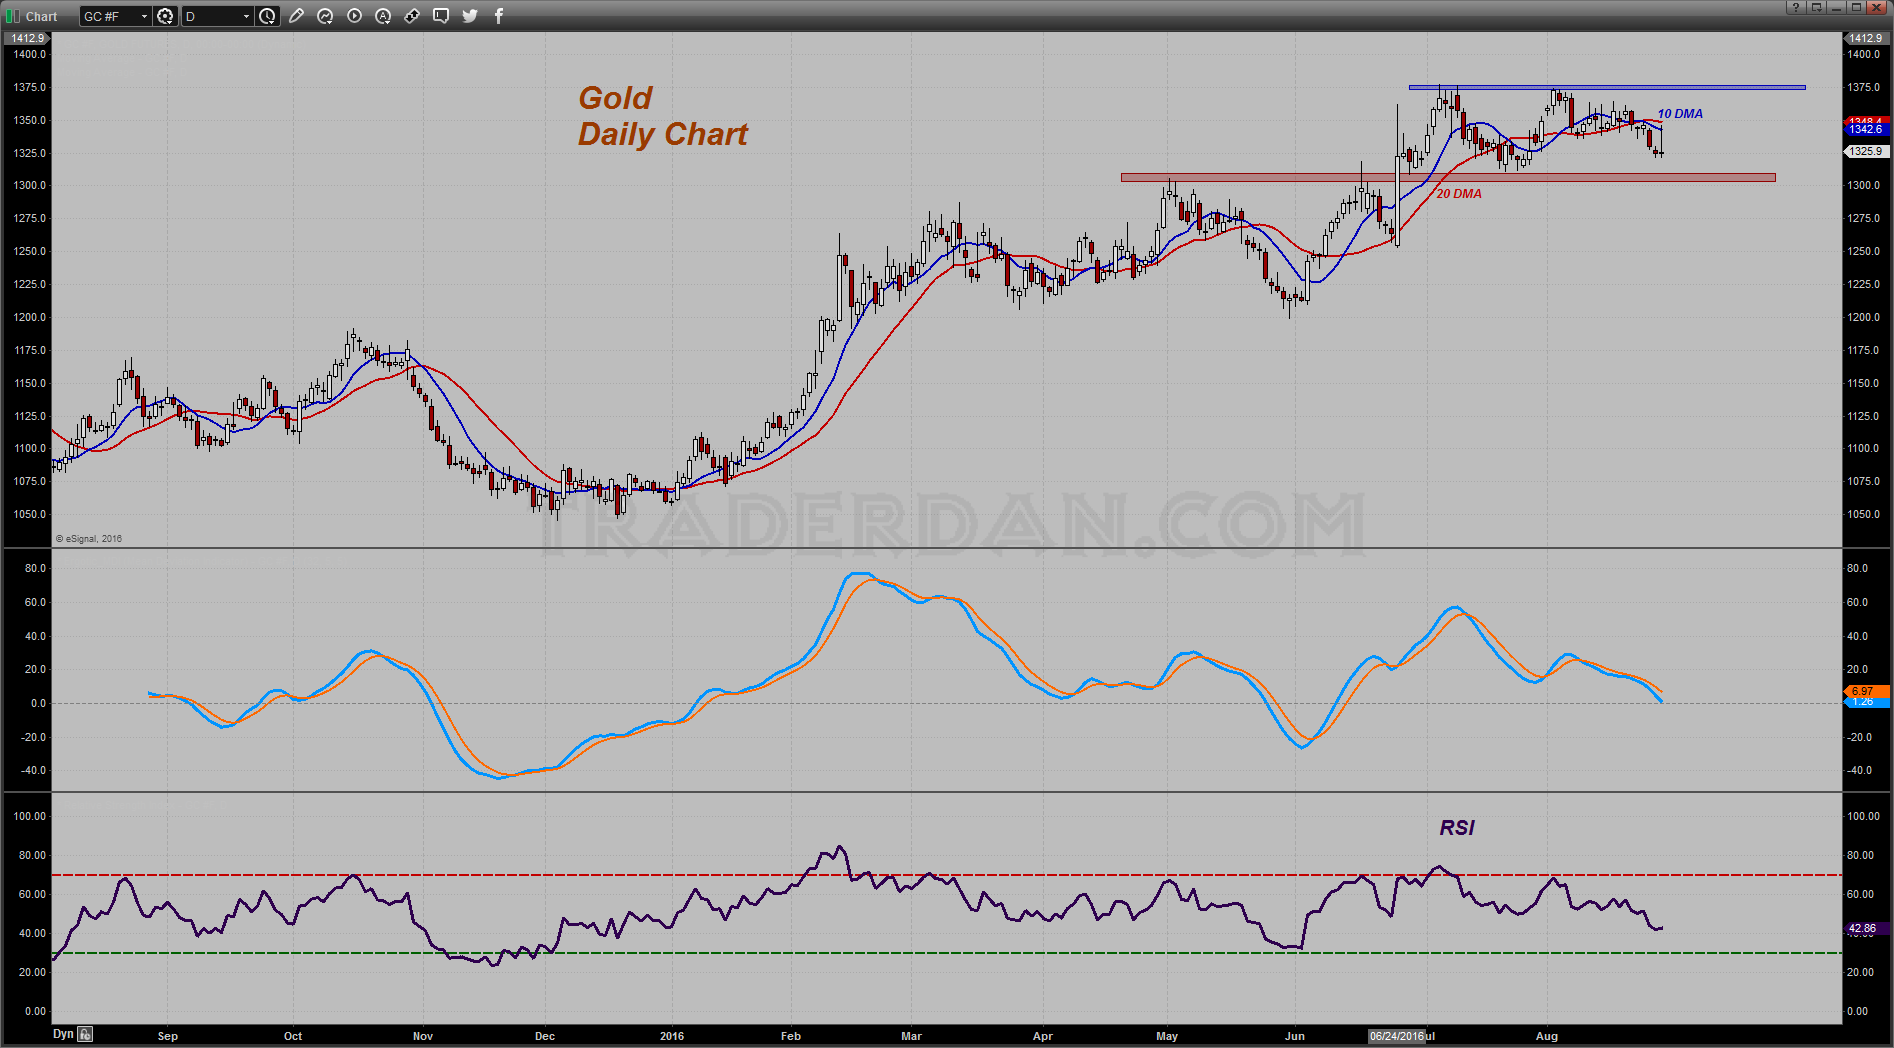
Short term charts are bearish at this time however. The big test for gold will be whether or not it can hold down at the July lows near $1312-$1313.
The Heikin Ashi format is still in sell mode as well with this particular style chart showing a second close below the 50 day moving average.
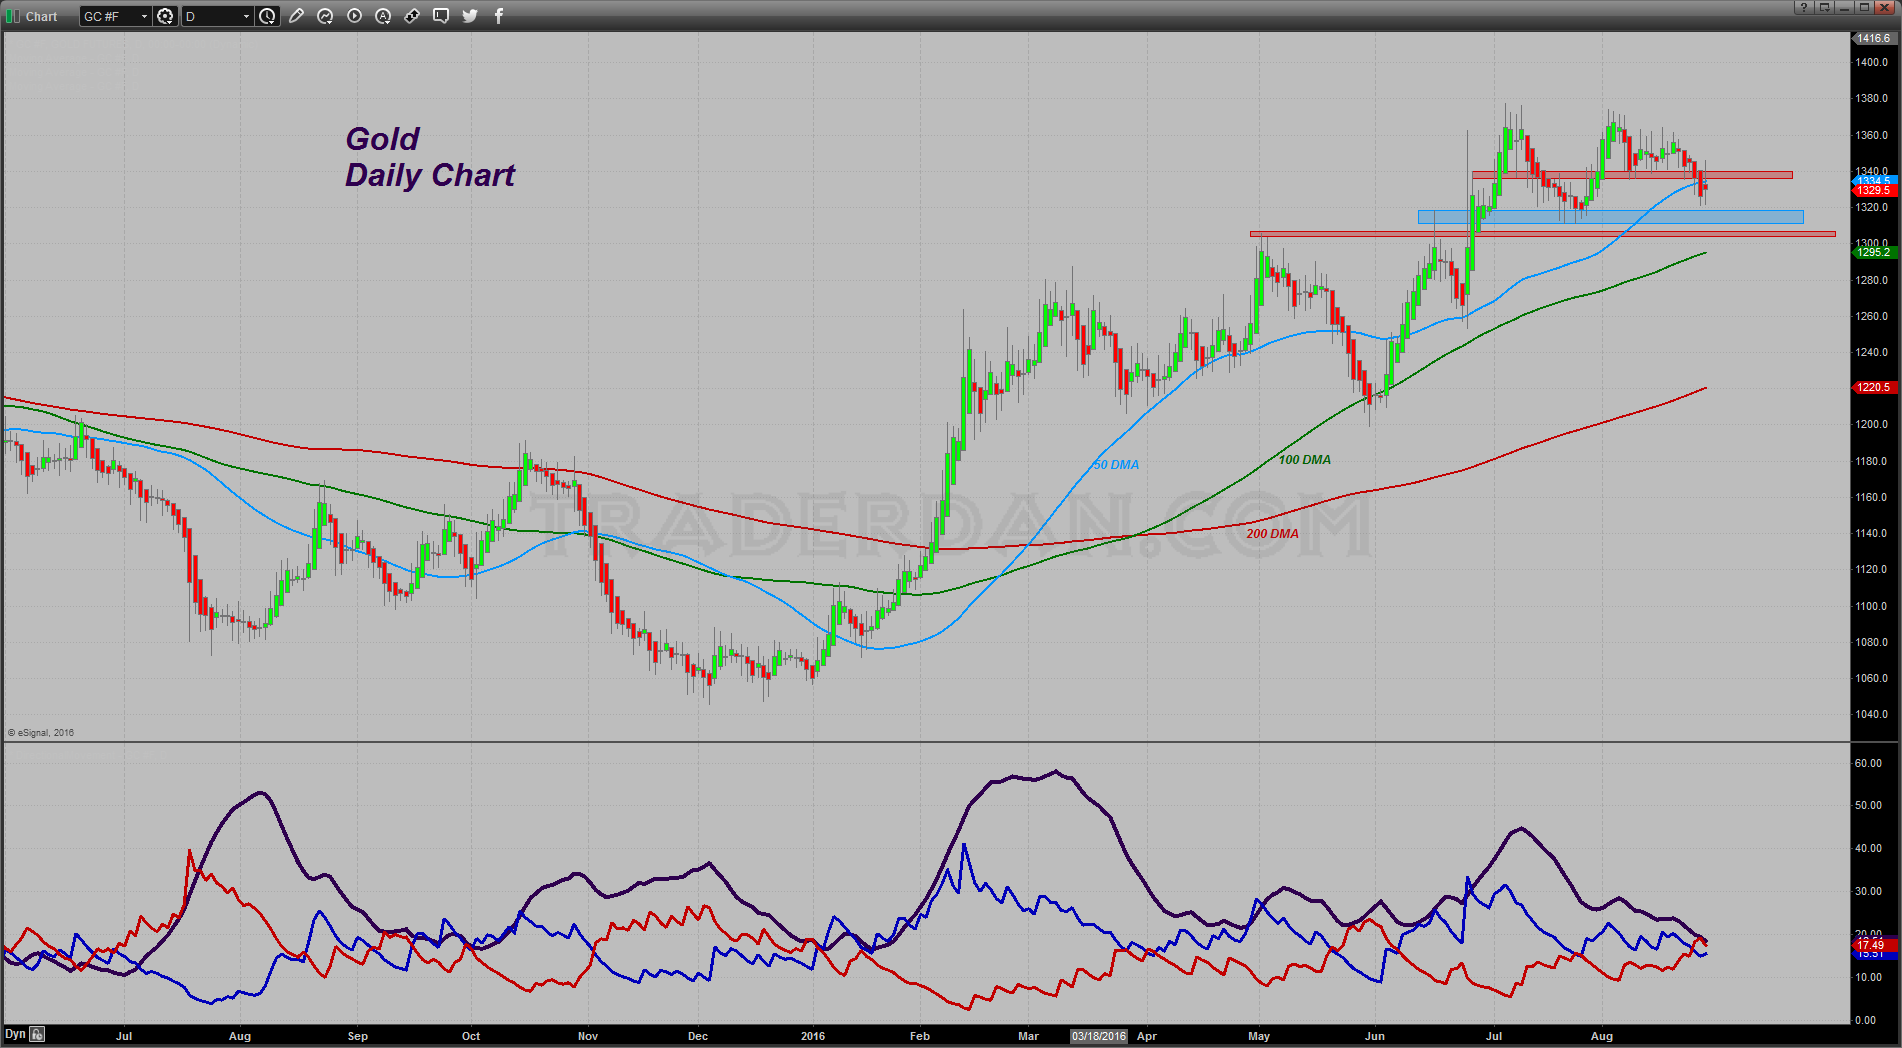
The ADX line is falling indicating that range trade with the -DMI above the +DMI indicating that the bears have short term control within the context of a range bound market.
As far as this week’s COT chart goes, we had a bit of movement but nothing of serious note. HOwever, it needs to be kept in mind that the day after the Tuesday cutoff, gold plunged $20 and ended on a weak note to close out this week.
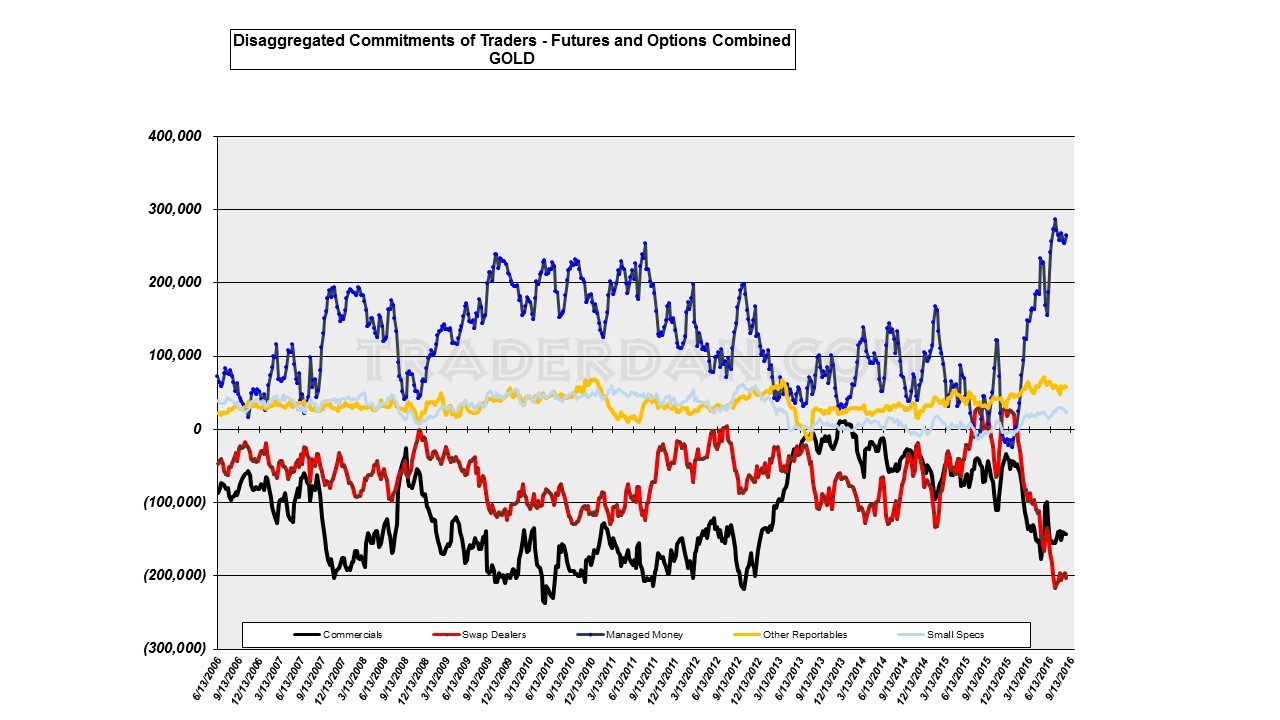
That hedge fund net long position still is looming over this market and if that bottom of the range near $1311-$1312 gives way, you will see some pretty heavy long liquidation by that group as the technicals are turning soft and they will not stick around for long if that continues.
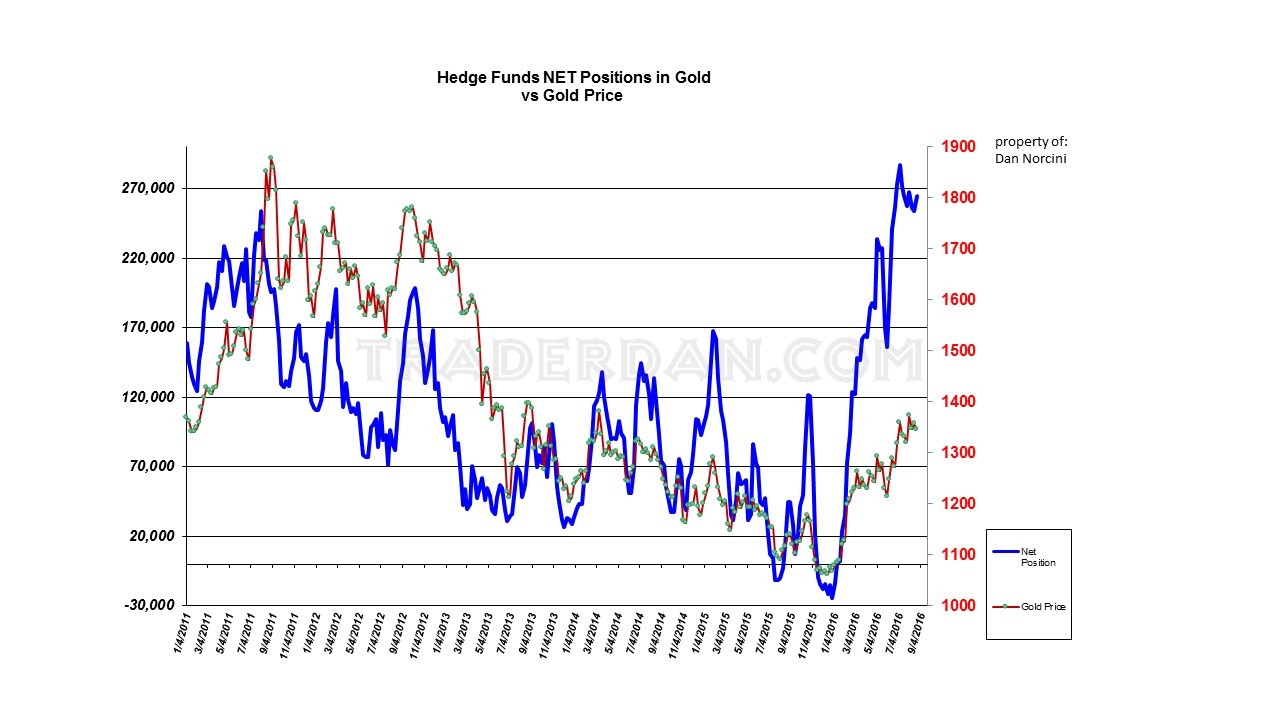
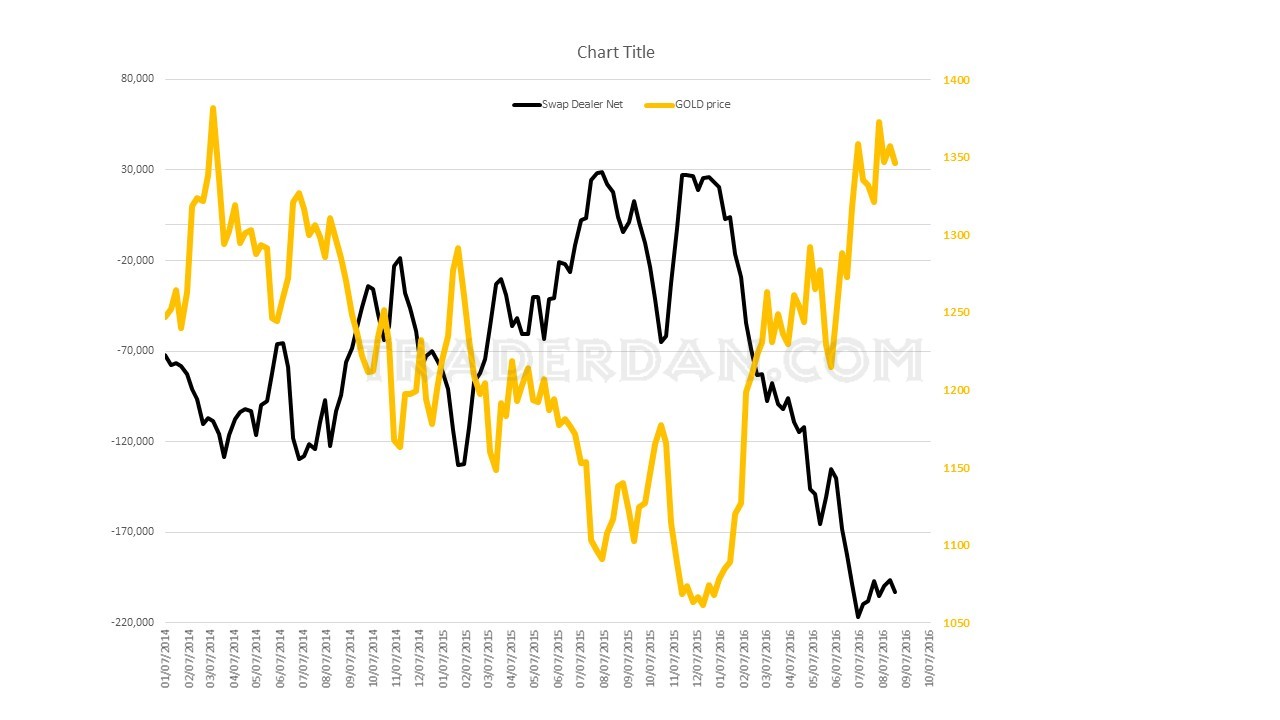
Of more concern to me is that the Swap Dealers, the group of traders with the overall best record for nailing tops and/or bottoms in the gold market, are still very, very short and still not far off from their recent all-time high short position in the metal.
The HUI remains unable to climb back into the GAP region created on Wednesday this week. It is holding the 100 day so the bulls can take some consolation in that but you can see the significance of the level near 235 on the chart. If that gives way, gold and silver are both heading lower.
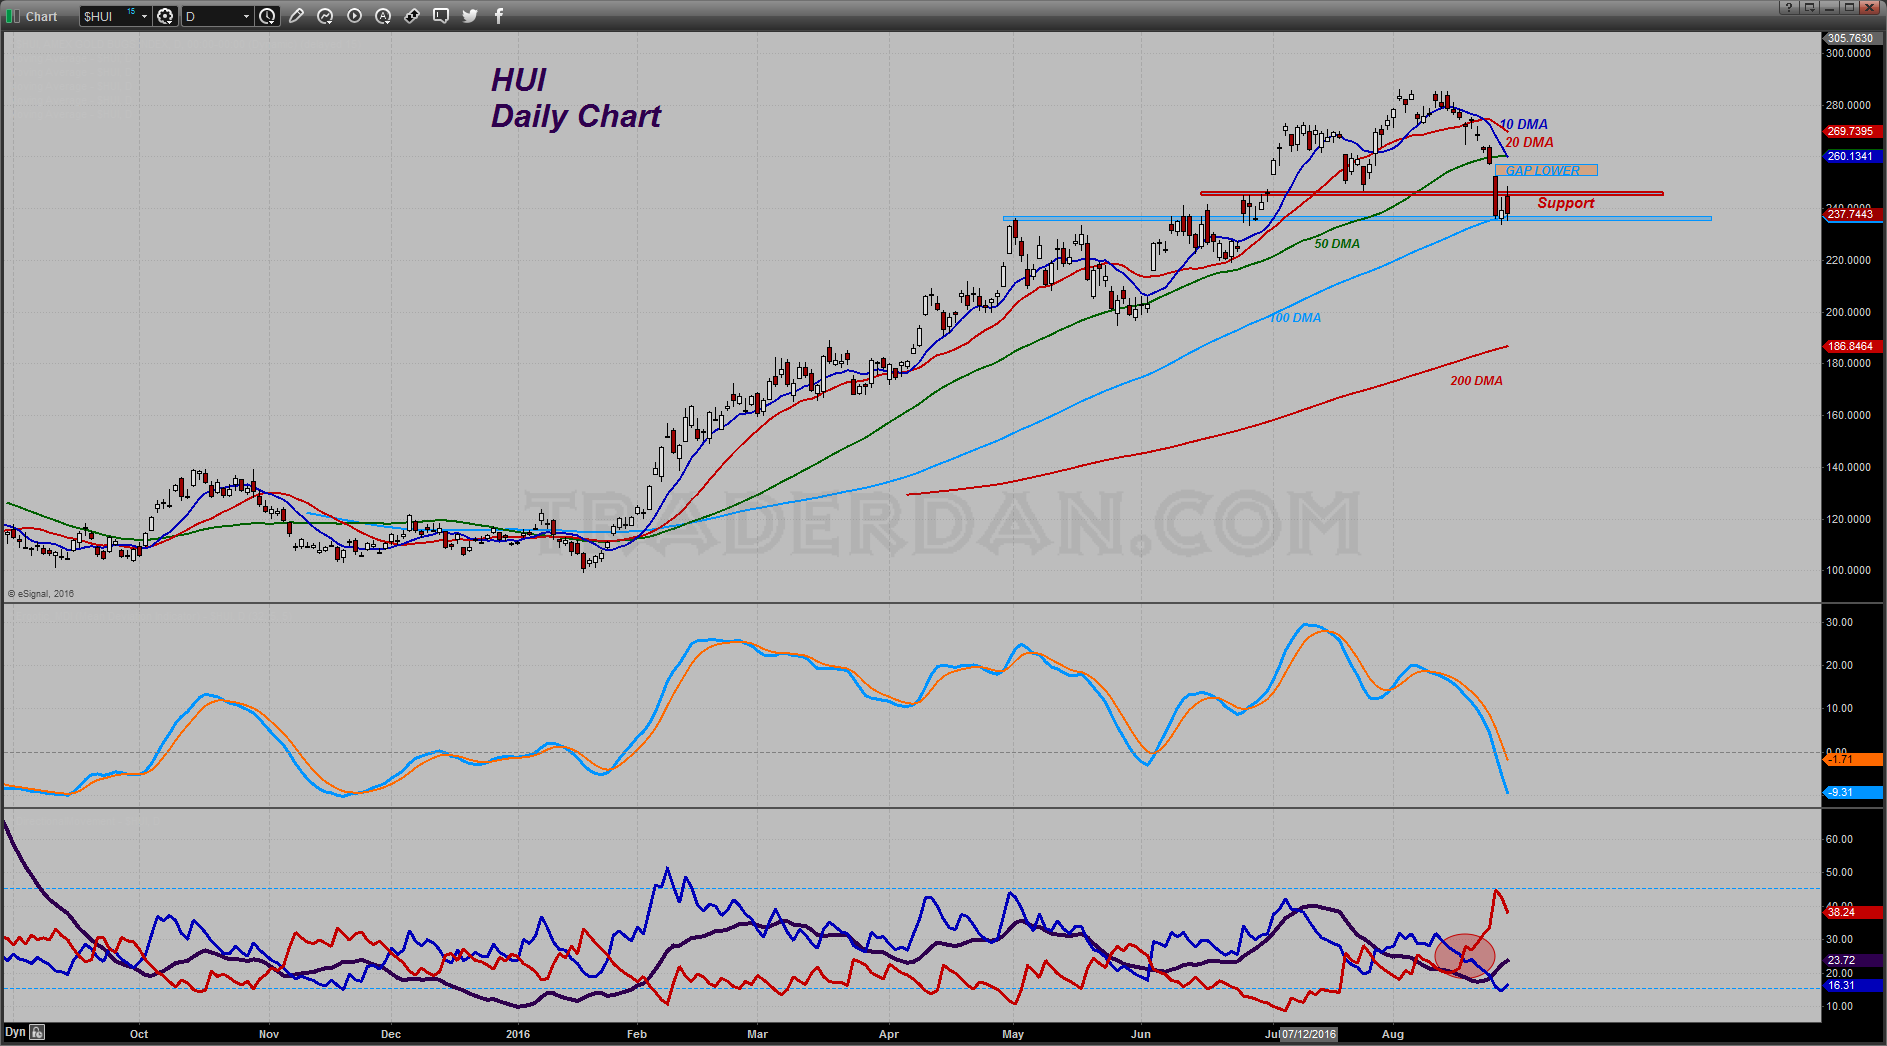
For the bulls to gain a further glimmer of hope in there, at the very least they need to close that GAP.
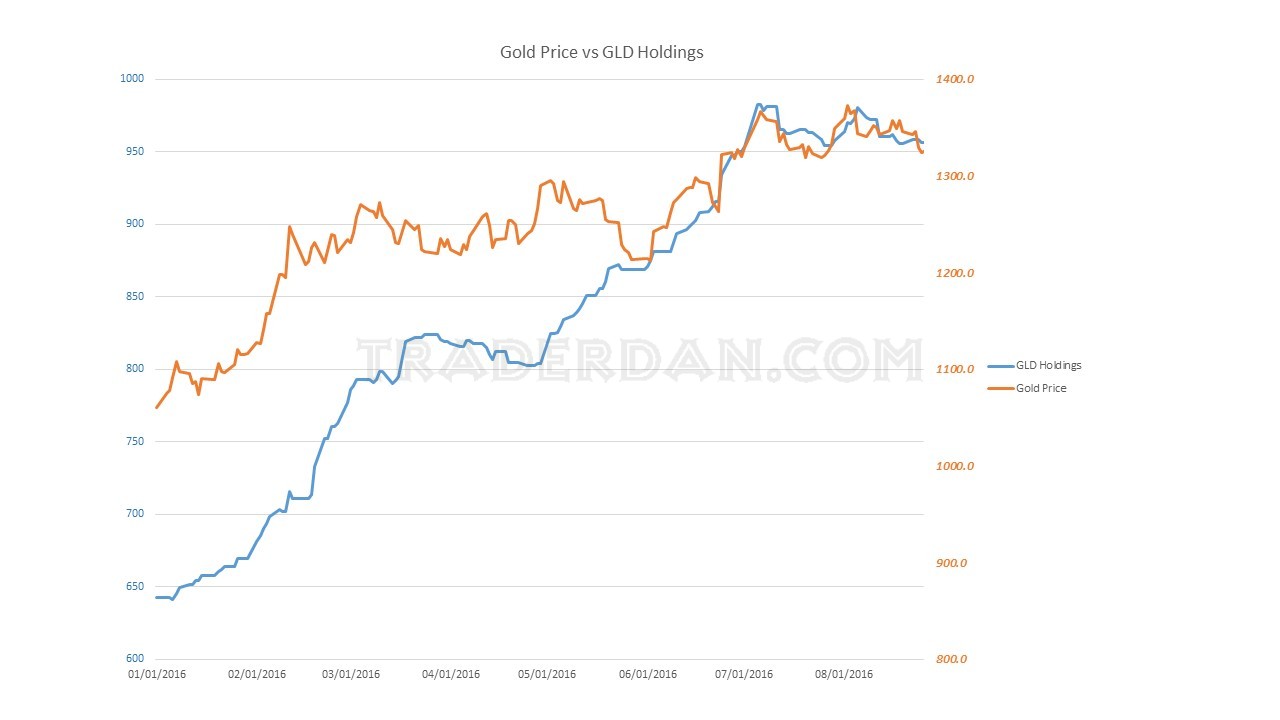
The gold ETF, GLD (NYSE:GLD), is at least holding relatively steady as far as its reported gold holdings go.
Taking a brief look at silver…. we are indeed seeing some long side liquidation by the hedge funds with that lopsided position of theirs finally succumbing to reality.
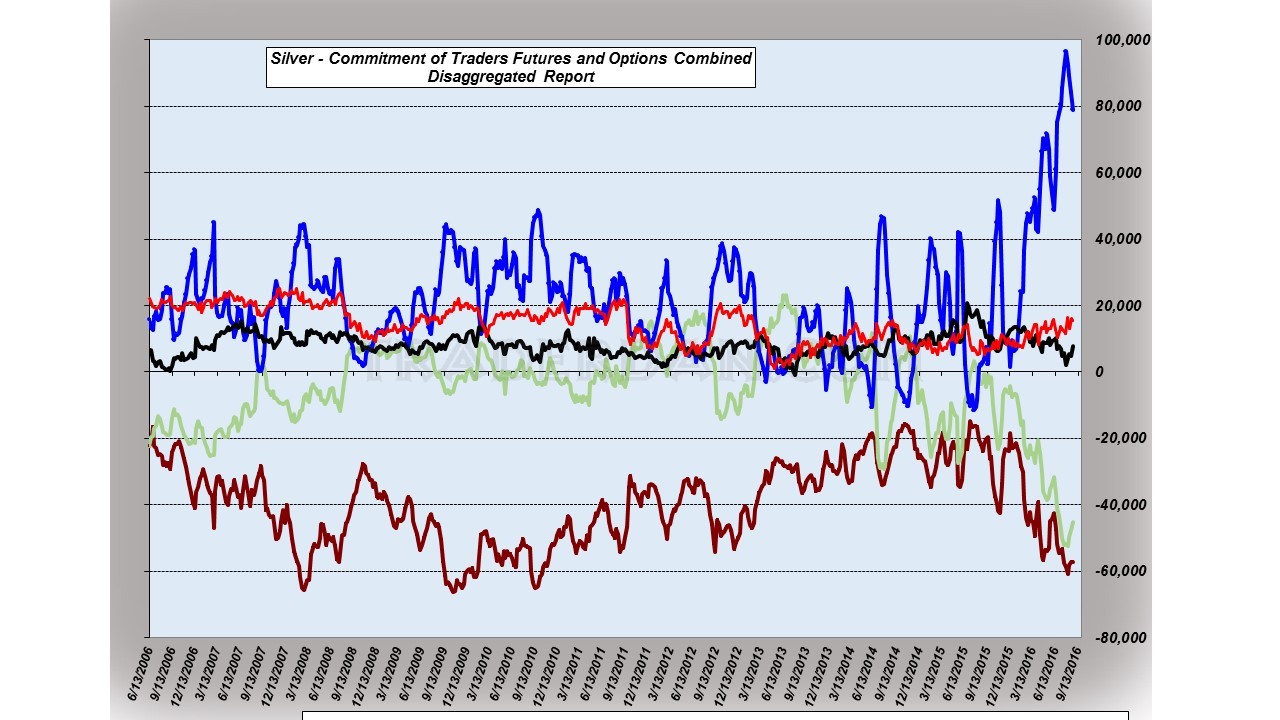
In all honesty, I have been expecting more long liquidation from that group than we are currently seeing.
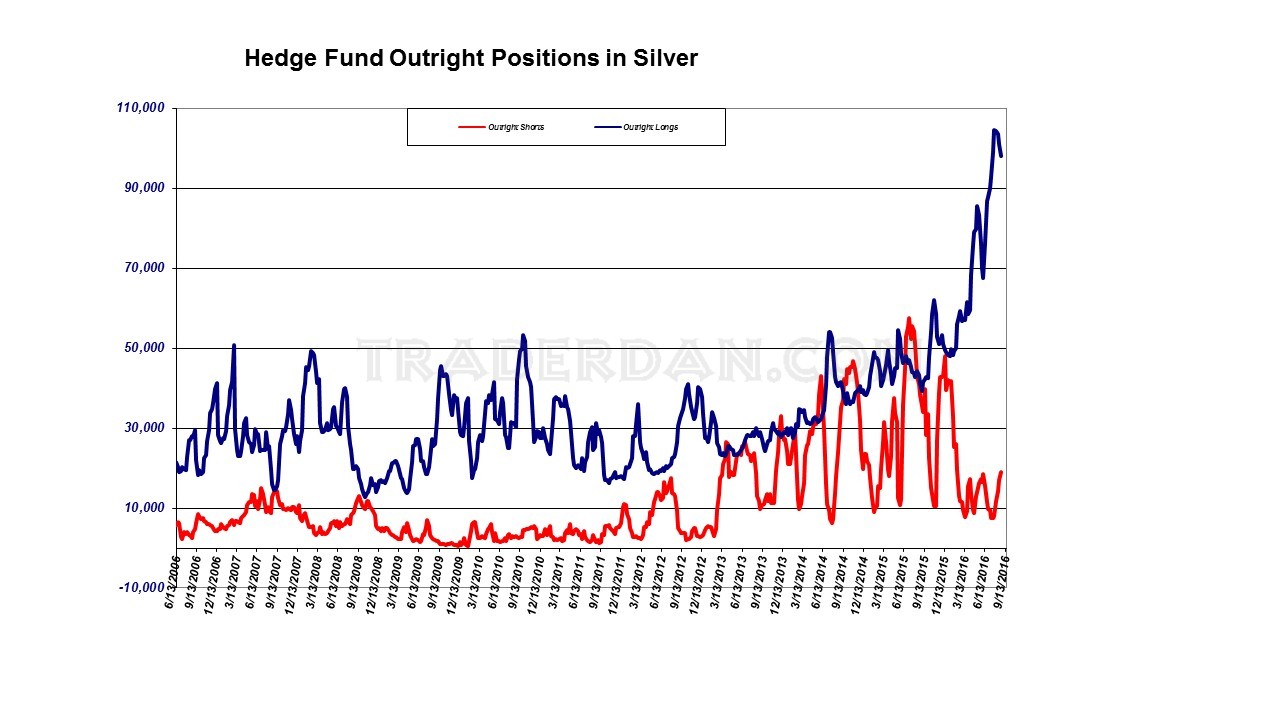
Interesting however is that the hedge funds have added about 8000 new short positions since the middle of July. Only 6000 longs have been liquidated since peaking early this month. They may not be coming off of their longs all that much but there is some movement towards the short side in a small way.
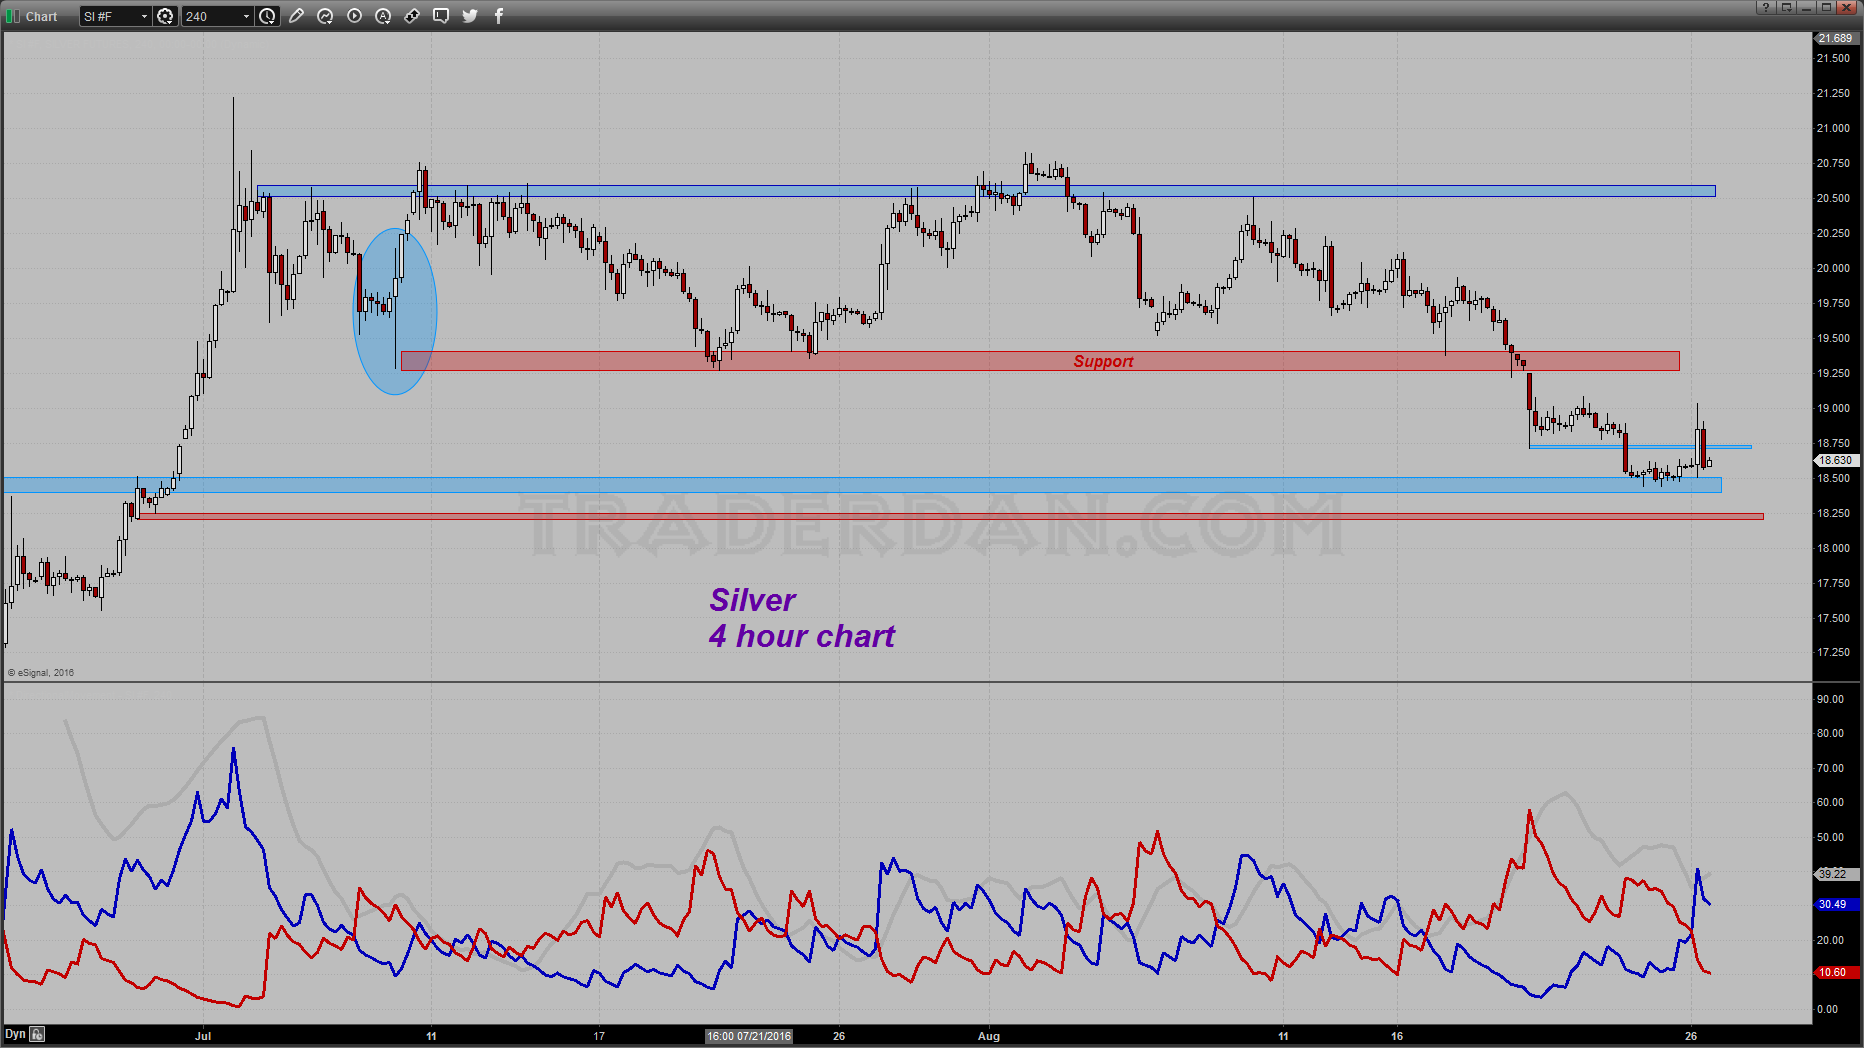
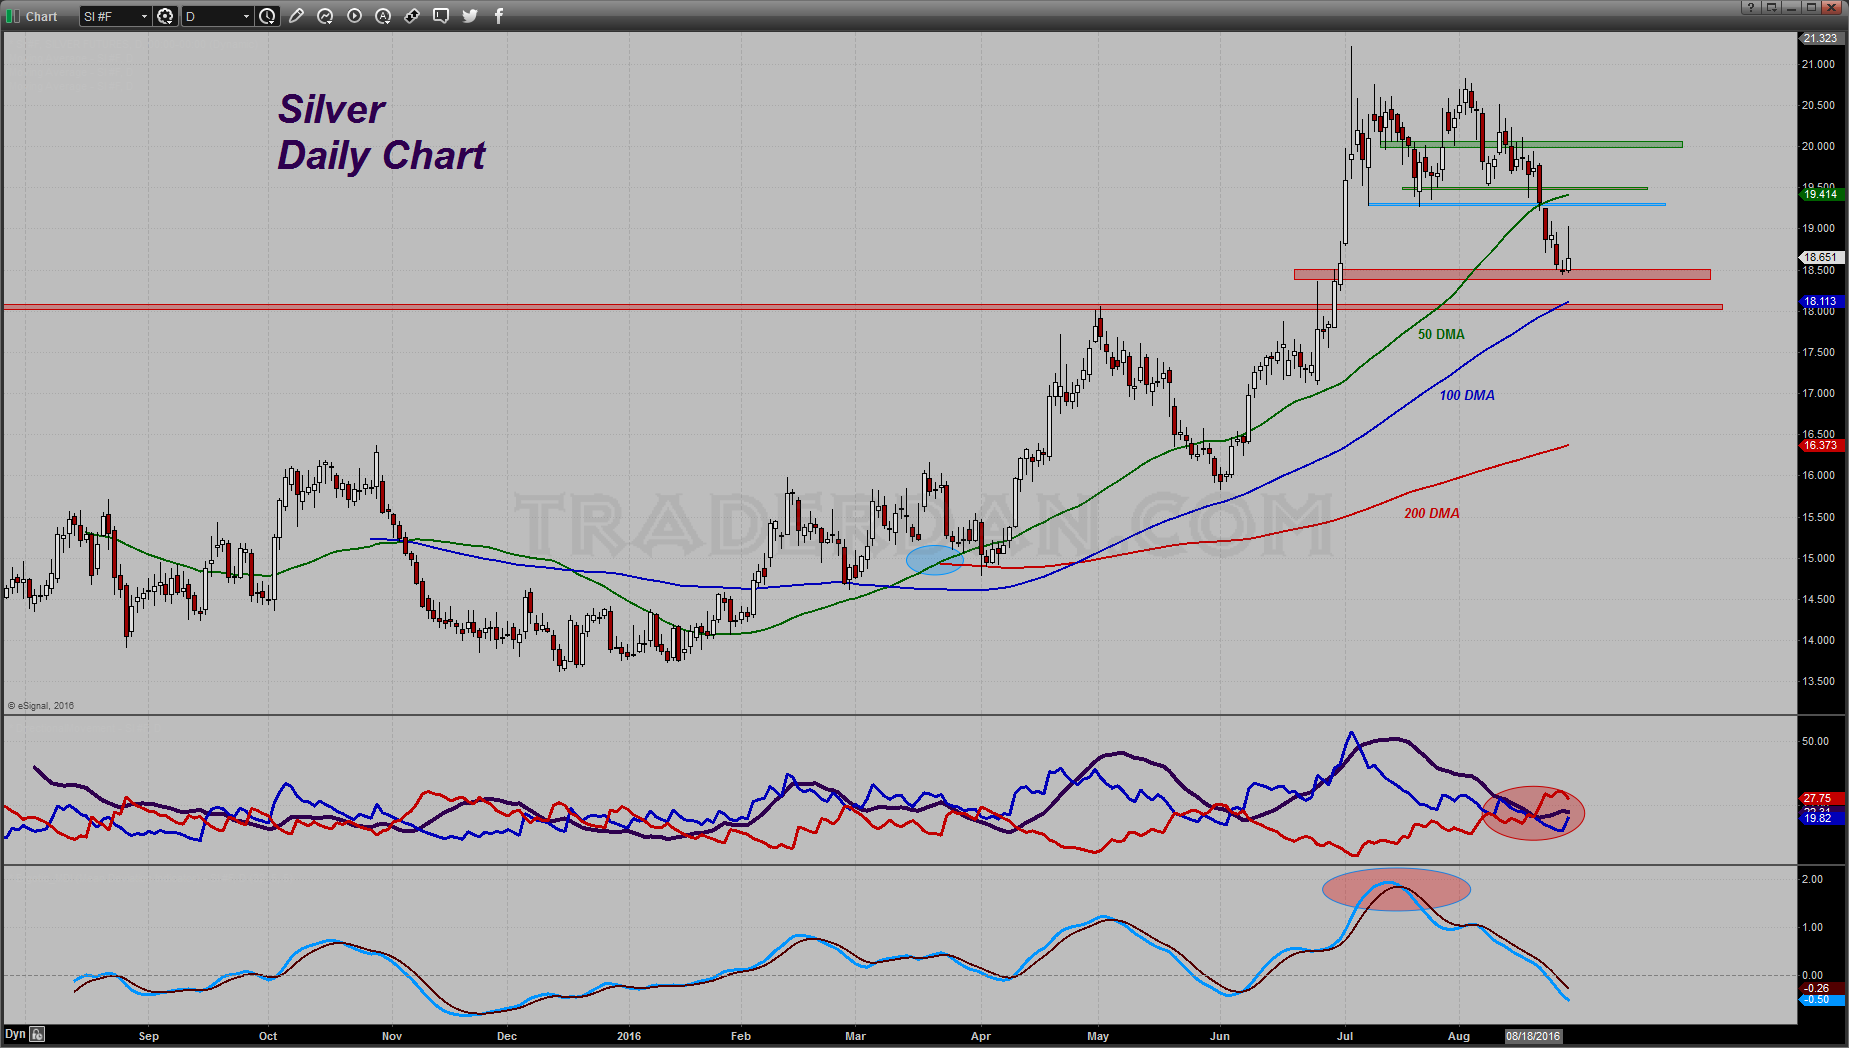
Both charts have a heavy look to them at the moment. Last week’s low near 18.43 needs to hold or silver will more than likely fall to the 100 day moving average. That will be a big, big deal if that level gives way because that will usher in a wholesale round of hedge fund long liquidation. That level happens to be very close to psychological support at the $18.00 level.
Bulls need to take price back through $19.30 on the topside to shift the current negative chart pattern somewhat.
Lastly, a short note on the Emerging Markets.
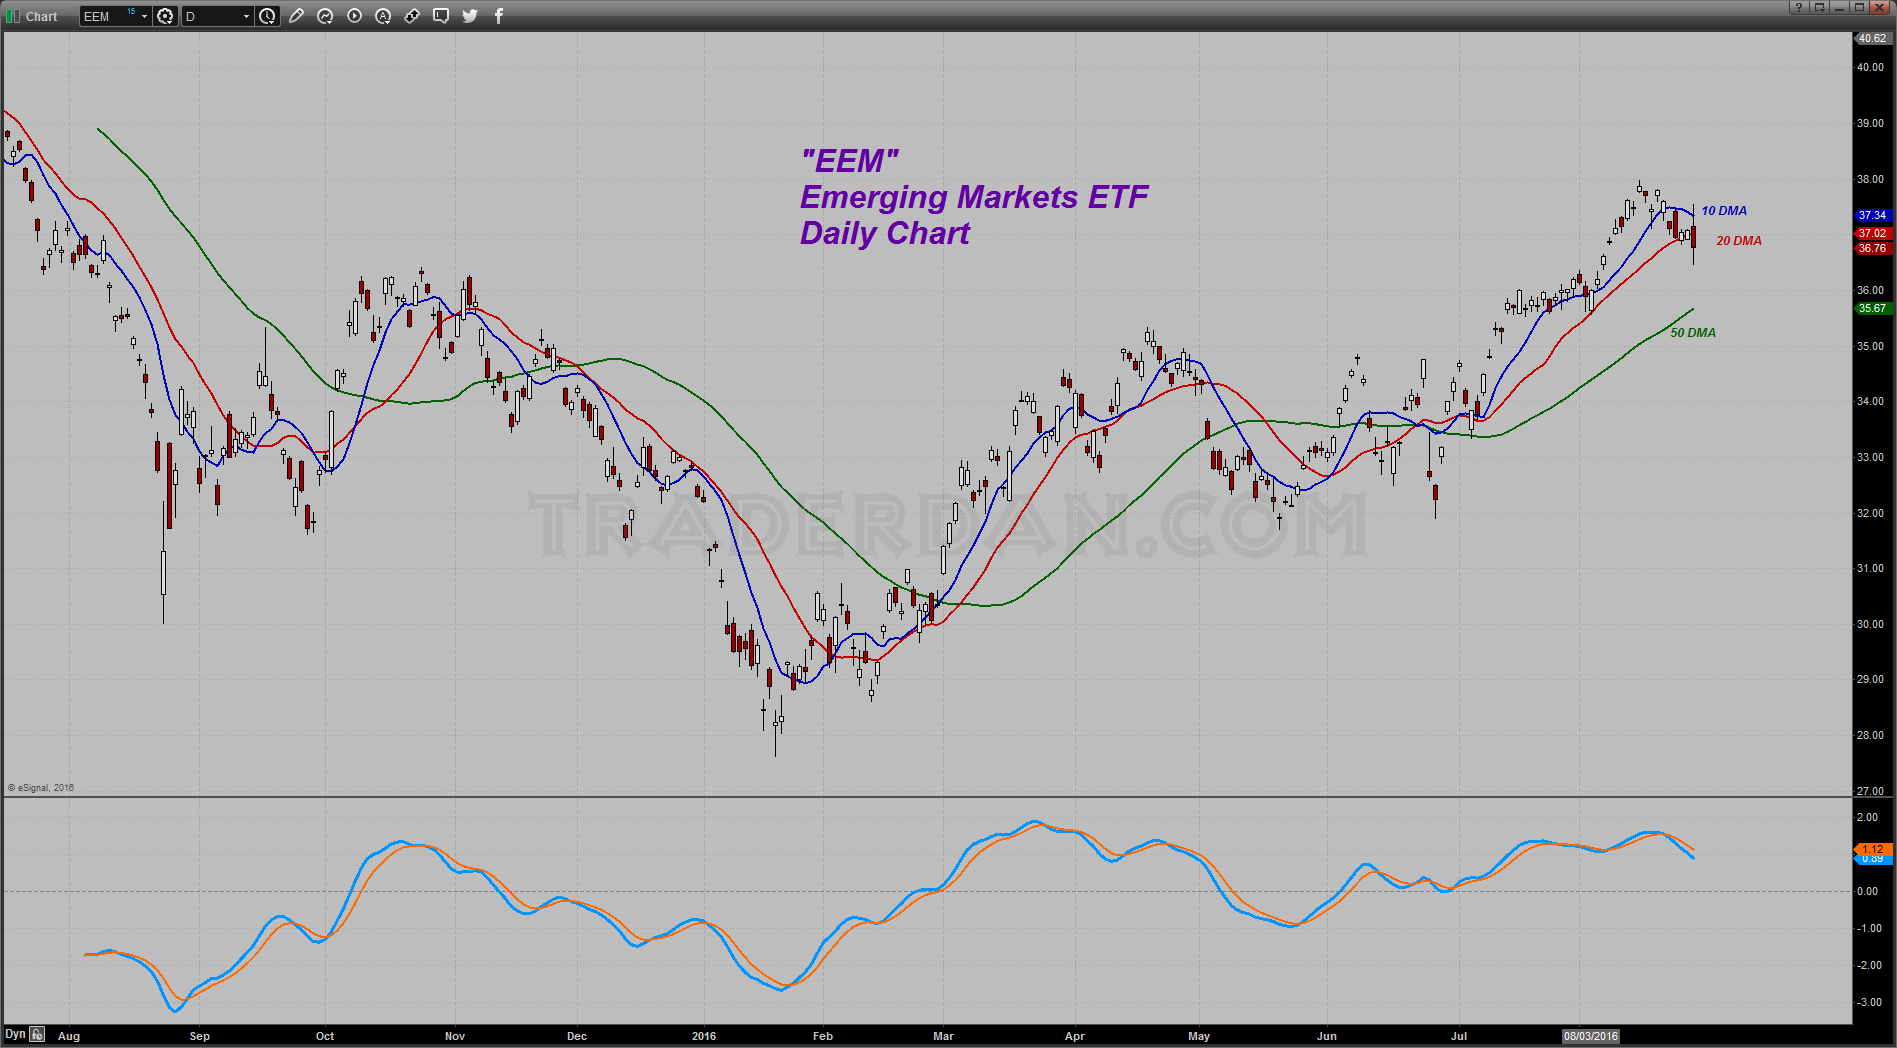
I recently noted their strong performance but also noted that this ETF is basically a play on whether or not one thinks the Fed is going to raise rates. Within the last week iShares MSCI Emerging Markets (NYSE:EEM) have weakened considerably so much so that the chart pattern is deteriorating in the short term. I am keeping a close eye on this particular ETF because a huge sum of money had been allocated to Emerging Markets since June. All of that money went into there because the odds that the Fed was going to move on rates was extremely low. That in turn kept the US dollar from advancing. If the Dollar starts to turn higher and if it looks like that is a trend we will see a significant amount of this hot money come out of this ETF and Emerging Markets in general.
The flip side to this particular ETF, “EEM”, is the inverse ETF, namely “ProShares Short MSCI Emerging Markets (NYSE:EUM)”.
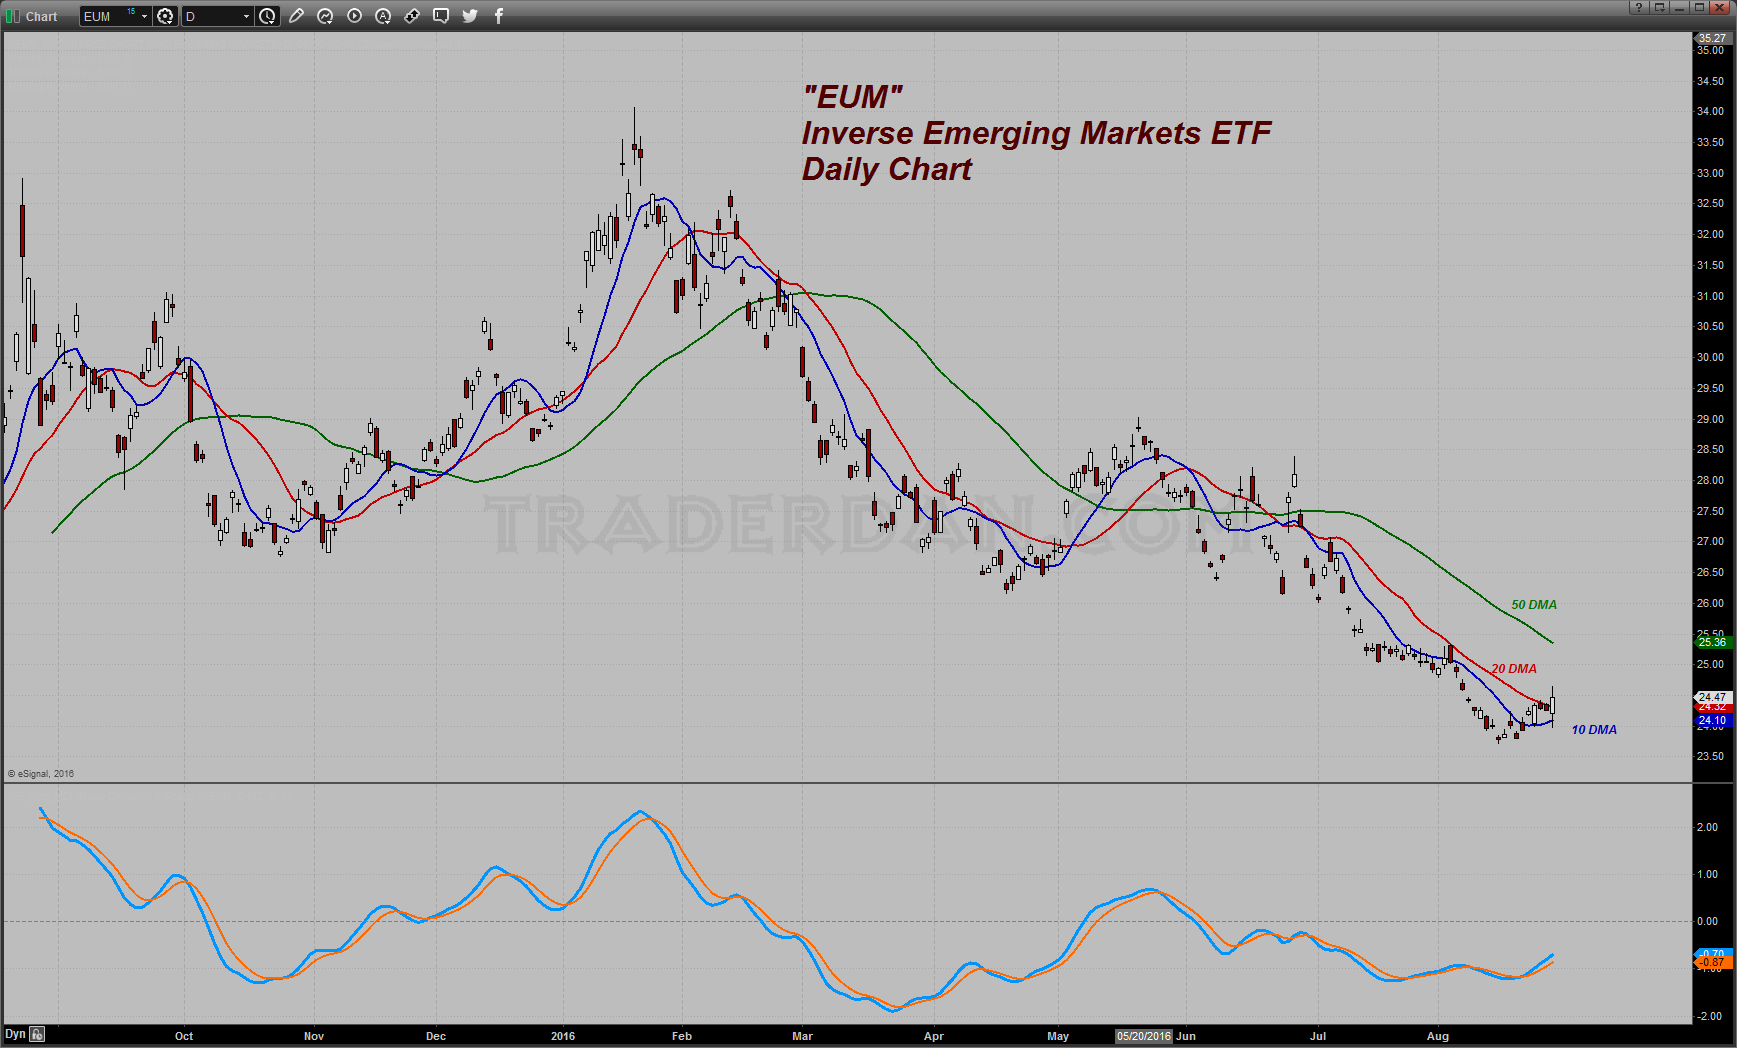
This one just flashed a buy signal this week with the close above both the 10 day and 20 day moving averages constructive in the near term.
The reason for this is that the Fed Funds futures are showing a bit higher probability of a rate increase coming in September. Prior to Yellen’s speech, odds of a rate hike in September were 21%. After the speech the odds rose to 33%. Not much, but definitely higher. That is why the Emerging Markets weakened.

