- Tariffs will remain in place till at least November
- U.S. drafting rules to further limit sales to Huawei.
U.S. equity futures and European stocks fluctuated, as they attempted to return to record highs amid lingering tensions hours ahead of the momentous signature for an initial agreement between the U.S. and China, the world’s two largest economies.
U.S. contracts offset most of an initial decline after the equities dropped yesterday from record levels following publication of a Bloomberg report that the White House will not rollback existing tariffs before the Presidential elections in November.
If that’s not enough, the U.S. is in the process of writing rules to further block sales to China’s Huawei, which has always been very sensitive to China.
The STOXX 600 Index fluctuated between gains and loss and remains, for now, little changed.
Asian stocks were shaken by the news that tariffs will stay in place against China, with the Shanghai Composite (-0.54) leading the region lower. However, with China, the worst performer, losing just half a percentage point, it doesn’t seem too bad.
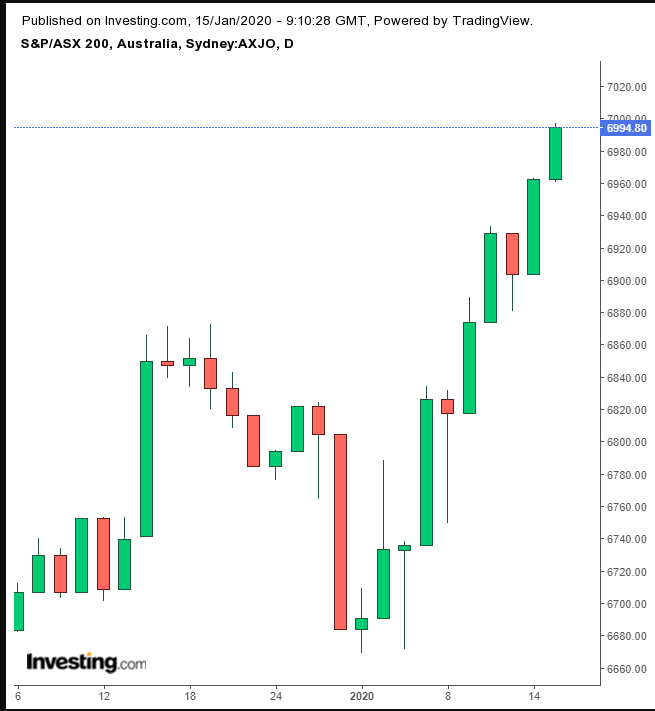
Australia’s ASX 200 (+0.47%) outperformed due to its sensitivity to gold prices, which climbed for the second day, as disappointed investors sought refuge from a market backlash to the negative trade news. The ASX posted a dual record, on both a closing basis and intraday high, thanks to gold related stocks.
Yesterday, the news that billions of dollars of Chinese imports will remain taxed at least till November cooled investors’ enthusiasm just one day before the much anticipated Phase One signing ceremony. The Nasdaq Composite (-0.24%) underperformed, as tech stocks dragged on the index, having become a proxy trade for the U.S.-Sino trade dispute.
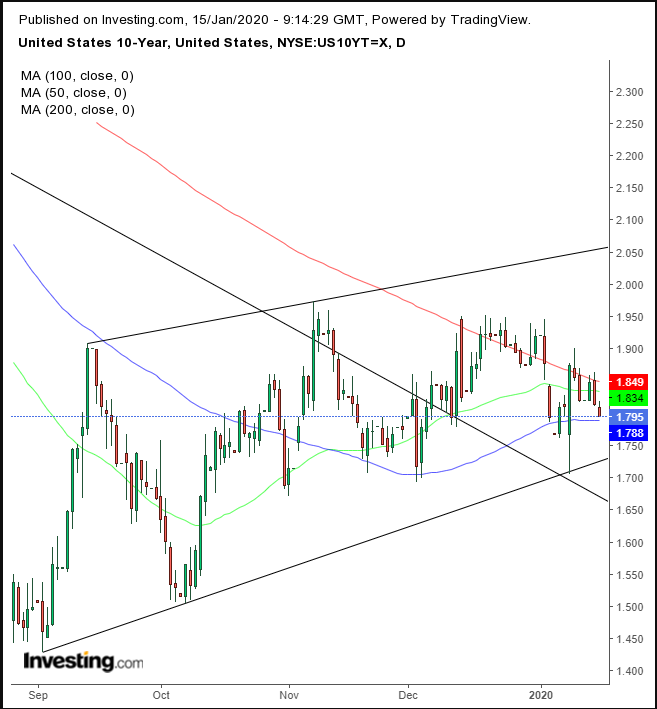
10-year yields extended a drop away from the 200 DMA, nearing the bottom of the rising channel since the Sept. 3 bottom. The uptrend in the short term has been struggling to break free of the downtrend since the November 2018 high.
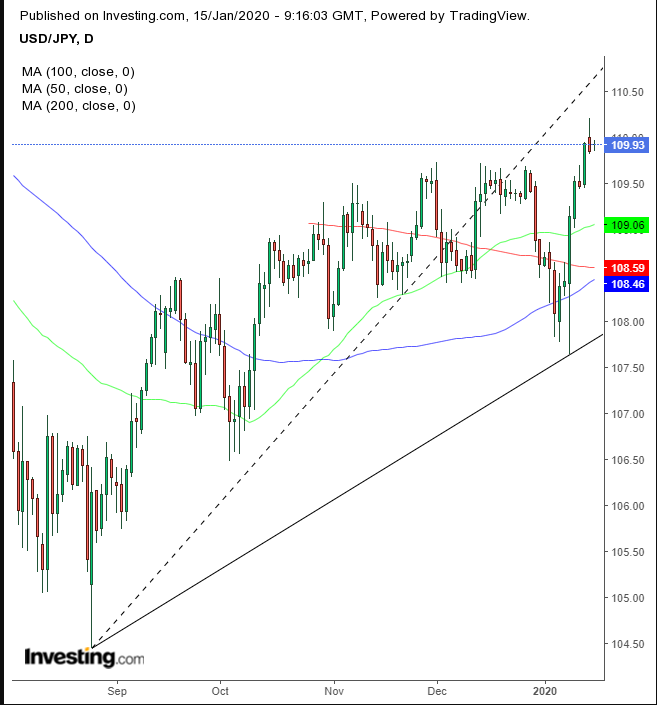
Despite the risk-off, the USD strengthened versus the yen. However, it is still beneath the resistance of yesterday’s shooting star, upon reaching the highest level since May.
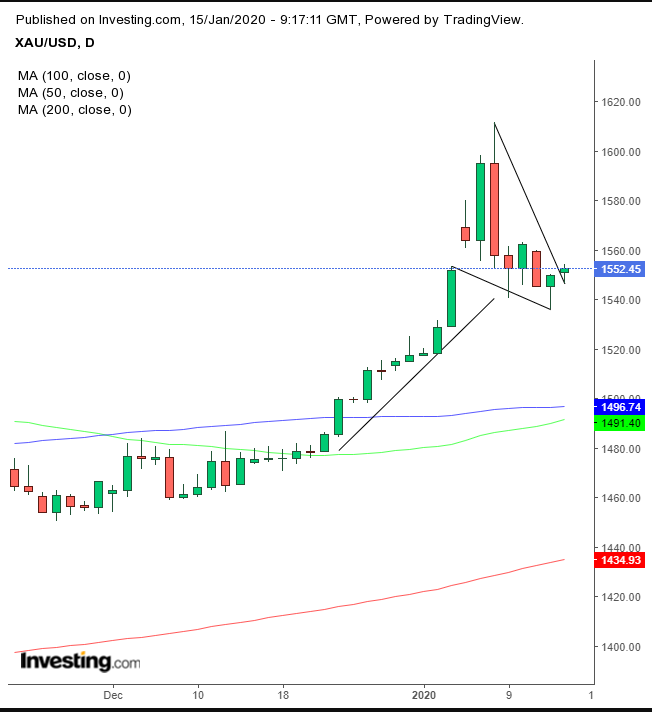
Gold advanced for the second day, potentially breaking the topside of a bullish pennant.
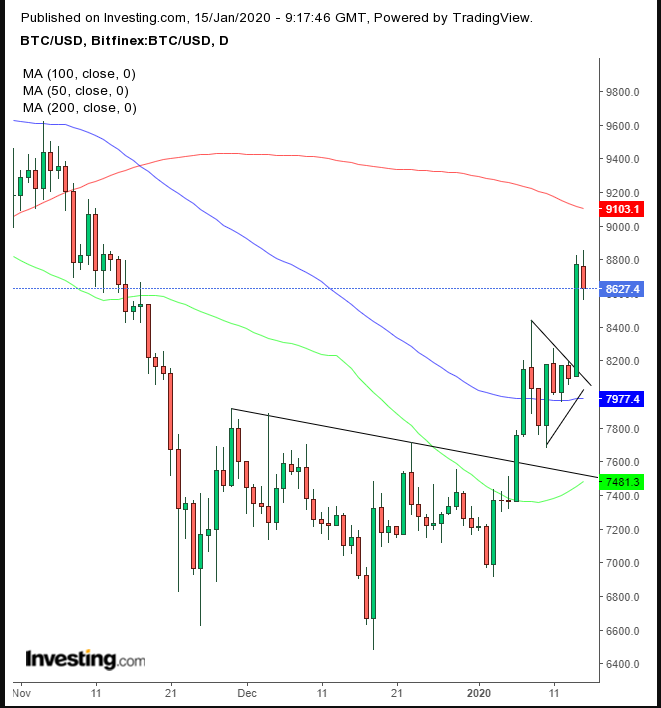
Bitcoin rejoined havens after yesterday exploding out of a bullish pennant, having completed a bottom.
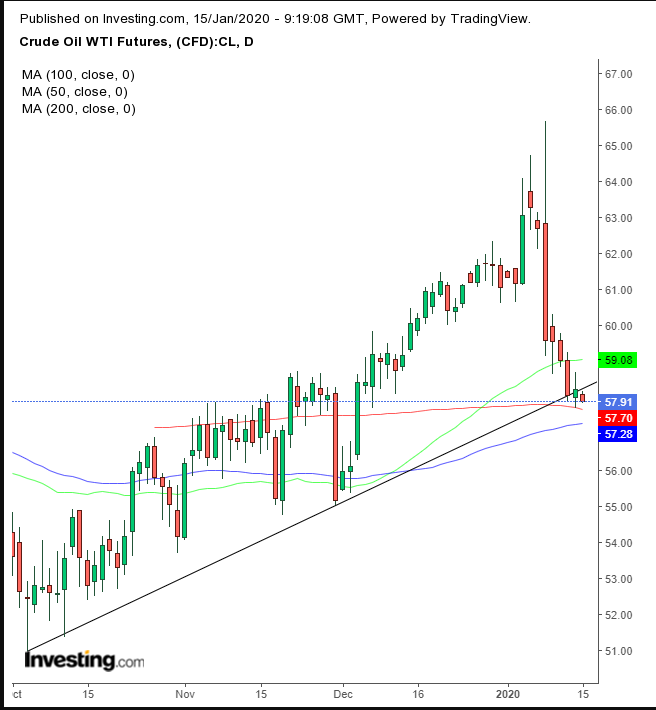
Oil fell back below its uptrend line.
Up Ahead
- It’s earnings season for the biggest U.S. financial institutions with Bank of America (NYSE:BAC), Goldman Sachs Group (NYSE:GS), Morgan Stanley (NYSE:MS) and BlackRock (NYSE:BLK) among the next up.
- The Federal Reserve’s Beige Book report on regional economic conditions is due on Wednesday.
- China GDP, along with key monthly data for December, come on Friday.
- A final reading on the euro-zone’s December inflation is also due on Friday.
Market Moves
Stocks
- The Stoxx Europe 600 Index fell 0.2%.
- Futures on the S&P 500 Index dipped 0.2%.
- The U.K.’s FTSE 100 Index decreased 0.1%.
- The MSCI World Index of developed countries fell 0.1%.
- The MSCI Emerging Market Index fell 0.4%.
Currencies
- The Dollar Spot climbed 0.1%.
- The euro was little changed at $1.1123.
- The British pound declined 0.1% to $1.301.
- The Japanese yen strengthened 0.1% to 109.92 per dollar
Bonds
- The yield on 10-year Treasuries declined two basis points to 1.79%.
- The yield on 2-year Treasuries decreased one basis point to 1.56%.
- Germany’s 10-year yield fell three basis points to -0.20%.
- Britain’s 10-year yield sank three basis points to 0.691%.
- Japan’s 10-year yield fell one basis point to 0.01%.
