- Europe, U.S. futures point to rebound from tech-probe selloff
- Facebook, Alphabet, Amazon and FedEx take the brunt of Monday's rout
- Yield slide eases; gold continues to gain on demand for safety
- Oil drops as demand dwindles and Saudi Arabia ups output
- China President Xi Jinping begins a two-day visit to Russia on Wednesday.
- Theresa May steps down as leader of the Conservative Party on Friday.
- Friday’s U.S. jobs report is projected to show payrolls rose by 190,000 in May, unemployment held at 3.6%, a 49-year low, and average hourly earnings growth sustained a 3.2% pace.
- The MSCI Emerging Market Index dropped 0.5%, the biggest drop in more than a week.
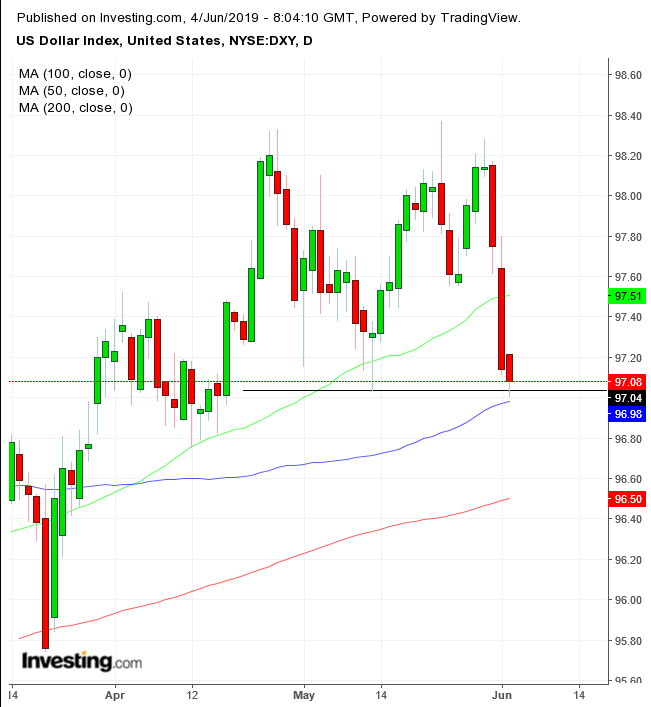
- The Dollar Index fell 0.05% to the lowest in three weeks.
- The euro gained 0.3% to $1.1274, the strongest in almost seven weeks.
- The Japanese yen climbed 0.2%, the strongest in five months.
- The Mexican peso edged 0.2% higher.
- The yield on 10-year Treasurys climbed two basis points to 2.10%, the first advance in more than a week.
- The yield on 2-year Treasurys increased three basis points to 1.87%, the largest increase in almost two weeks.
- Germany’s 10-year yield slid less than one basis point to -0.21%.
- Britain’s 10-year yield was unchanged at 0.866%.
- Italy’s 10-year yield rose three basis points to 2.588%.
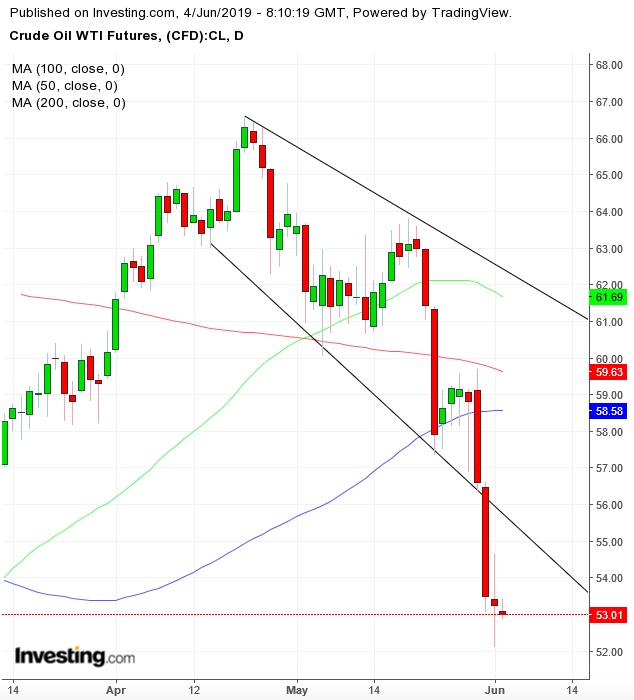
- West Texas Intermediate crude fell 0.4% to $53.17 a barrel, hitting the lowest in 20 weeks.
- The Bloomberg Commodity Index rose 0.2% to 77.65.
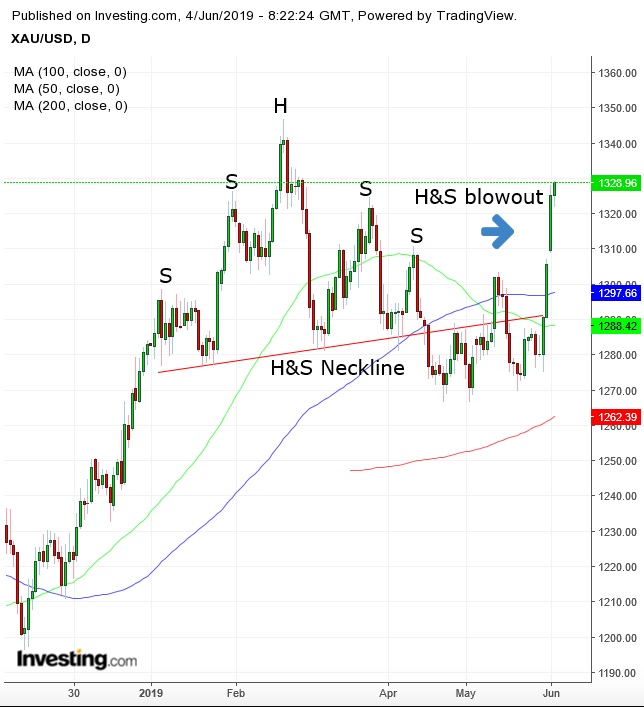
- Gold climbed 0.2% to $1,328.48 an ounce.
Key Events
European equities and futures on the S&P 500, Dow and NASDAQ 100 rebounded this morning following a tumultuous Asian session, suggesting U.S. indices may be able to reverse Monday's losses later in the day. Upbeat NASDAQ contracts in particular confirmed that yesterday’s steep rout, triggered by reports of a brewing U.S. probe into the biggest names in tech, may have eased.
The STOXX 600 slid half a percentage point in the first three minutes of trade, with technology stocks leading losses, but then pared most of the slide, finding support by the 200 DMA. After three straight days in which the pan-European index fell below buy rebounds, we might expect volatility to break through the trading range.
After falling below its 50 DMA in May, which later turned to resistance, followed by another drop below the 100 DMA for the first time since crossing above it in January, momentum is to the downside. Subsequent to completing a H&S top last week, the supply-demand balance is indeed presumed to be tilted to the side of the sellers. How European tech stocks perform today might give us a clue to the upcoming performance of the corresponding U.S. sector.
During the earlier Asian session, regional stocks all extended a rout as weak economic data and an intensifying Sino-U.S. trade war magnified worries about global growth. However, the session ended mixed, as some benchmarks managed to trim losses by the closing bell.
China’s Shanghai Composite gave up 0.96%, extending a drop below its 100 DMA, toward the bottom of a descending triangle, whose downward bias suggests a continued slide from the April highs, to challenge the 200 DMA below 2,800.
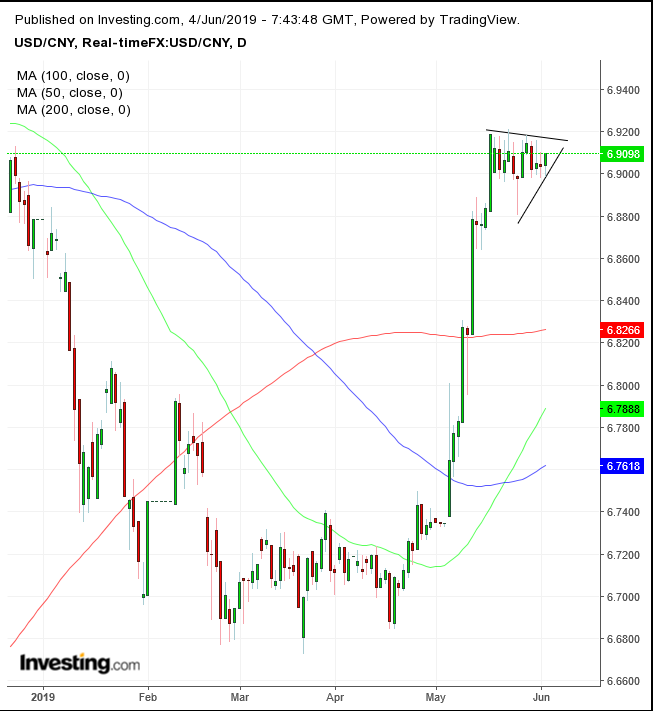
Yuan traders speculate China will allow its currency to fall below the psychological 7.000 mark, which it had been defending up to now. Analysts are betting that the PBoC will refocus on accommodation to stimulate growth, by leveraging a weak yuan to increase global market share, something that has been irking the U.S. president and that was a major trigger of the trade war.
On the other hand, a growing consensus for a U.S. rate cut may mitigate that factor, which otherwise holds the potential to exacerbate a diplomatically sensitive issue. However, it is unlikely that a move by the Fed would sway Donald Trump’s bargaining position.

The dollar-renminbi pair has been consolidating since the second half of May in a pennant-shaped pattern after a 2.75% jump in the first half of the month. This pattern suggests an upside breakout would take on the 'forbidden' 7.000 level.
St. Louis Federal Reserve President James Bullard said on Monday that the Fed will need to fine-tune its policy decisions to "help sustain the economic expansion”, and indicated that an interest rate cut could be warranted—which also helped shares in Europe and U.S. contracts higher.
Meanwhile, Trump is upping his trade blows at China by targeting Chinese students in the U.S.
Australia’s S&P/ASX 200 outperformed, eking out a 0.19% gain as major banks edged higher after the country's central bank cut the cash rate to 1.25%, a record low.
Global Financial Affairs
On Monday, U.S. equities extended a decline after weak manufacturing data added to global growth fears underscored by similar downbeat figures in Germany, the U.K. and Japan.
But it was the tech-heavy NASDAQ Composite to take the brunt of selling (-1.61%), after reports the U.S. government is preparing to investigate the growing market influence of U.S. tech giants. Presidential candidate Senator Elizabeth Warren, Democrat of Massachusetts, said in a March post that she wants to name regulators to undo “anti-competitive mergers”—which include Google’s deals with smaller companies such as Nest and Waze.
Alphabet (NASDAQ:GOOGL) tumbled the most since April to the lowest price in five months (-6.12%), after Bloomberg reported the Department of Justice will look into its business. Evercore ISI analyst Kevin Rippey explains why Alphabet's stock is particularly sensitive at present:
“The investigation comes at a time when the stock’s bull case is challenged by concerns of an abrupt revenue slowdown last quarter (the company’s sells have been falling).”
And Stifel analyst Scott Deitt doesn’t see the situation changing:
“It is hard to quantify implications without further information, but this could serve as an overhang on Alphabet shares for some time (The company could be subject to an investigation for a while).”
We can see on the chart how the uptrend since the beginning of the year reversed, after completing a H&S top, with a falling breakout gap, after falling below the 200 DMA—three bearish indicators in a row.
The next major support is the $970 Dec. 24 low. If that support breaks, the next is at the $970s. Note that, naturally, there will be considerable volatility until then, which means the stock will move up, as well as down.
Meanwhile, Facebook (NASDAQ:FB) shares dropped 7.51%, underperforming among the FAANG stocks, while Amazon.com (NASDAQ:AMZN) lost 4.64%.
FedEx (NYSE:FDX) shares fell 4.75% since Thursday, when Huawei accused the U.S. shipping company of diverting packages from their destination to comply with the U.S. ban on Huawei itself, prompting an investigation by the Chinese government.
The stock hit the lowest level since July, 2016 yesterday and crossed below its uptrend line since the 2009 bottom, for the first time in ten years, suggesting an end to the long-term uptrend. However, the weekly trading pattern in December formed a bullish hammer, which means the price could find support at these levels. In other words, even if prices continue sliding lower, it could be after extreme whipsaws in the price.

The yield on 10-year Treasurys climbed for the first time in a week, pulling up the dollar. The Dollar Index found support by the 100 DMA and May hammer lows, which saved it—for now—from a small double top since late April.

In this backdrop, gold was up 0.25%, suggesting demand comes from its haven status, rather than from dollar weakness, and after a H&S top blowout.

Oil continued to inch lower as demand headwinds build up fighting over the $53 level, even though Iran’s output fell to the lowest level since 1990 due to U.S. sanctions. Saudi Arabia, Iraq and Libya increased their production, to offset the supply drop, thereby keeping oil prices under pressure on Monday. A secondary driver comes from reports that Trump may prefer diplomatic negotiations with Iran to avoid military conflict. However, after WTI's double-digit plunge in just three sessions, it’s best to wait for an upward correction before risking a short, at least to $55—the bottom of a falling channel—if not the $57 levels—a previous price congestion.
Up Ahead
Market Moves
Stocks
Currencies
Bonds
Commodities
