Technical Analsis
Technical Analysis HK50: 2019-06-11
Narrowing trade deficit bullish for HK50
Hong Kong trade deficit declined in May. Will the HK50 rebound continue?
Chinese economic data were positive recently: China’s trade balance was better than expected in May. Exports grew 1.5% in May from a year earlier when a 3.8% decline was forecast. At the same time the trade deficit in Hong Kong decreased to 35.1 billion HK dollars in April from 46.9 billion in the same month a year ago. China is Hong Kong’s top trading partner, and better than expected Chinese economic performance bodes well for Hong Kong’s economy too. And while the continuing US-China trade dispute is a downside risk for Hong Kong stock market it could prompt Beijing to step up stimulus measures before a deal is reached.
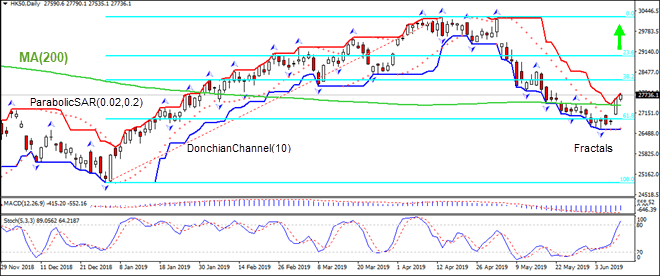
On the daily timeframe HK50: D1 has breached above the 200-day moving average MA(200). This is bullish.
The Parabolic indicator has formed a buy signal.
The Donchian channel indicates uptrend: it is widening up.
The MACD indicator is below the signal line with the gap narrowing. This is a bullish signal.
The Stochastic oscillator is rising and has breached the overbought zone, this is bearish.
We believe the bullish momentum will continue after the price breaches above the higher Donchian boundary at 27790.1. This level can be used as an entry point for placing a pending order to buy. The stop loss can be placed below the lower Donchian boundary at 26604.6. After placing the pending order the stop loss is to be moved every day to the next fractal lpw, following Parabolic signals. Thus, we are changing the expected profit/loss ratio to the breakeven point. If the price meets the stop-loss level (26604.6) without reaching the order (27790.1) we recommend cancelling the order: the market sustains internal changes which were not taken into account.
Technical Analysis Summary
- Position Buy
- Buy Stop Above 27790.1
- Stop loss Below 26604.6
Market Overview
US stock market rebound continued on Monday led by technology stocks. The S&P 500 gained 0.5% to 2886.73. Dow Jones industrial added 0.3% to 26062.68. The Nasdaq composite rose 1.1% to 7823.17. The dollar turned higher yesterday: the live dollar index data show the US Dollar index, a measure of the dollar’s strength against a basket of six rival currencies, rose 0.2% to 96.768 and is higher currently. Futures on US stock indices point to higher openings today.
FTSE 100 top performer among European indexes
European stocks extended gains on Monday. Both EUR/USD and GBP/USD turned lower with euro higher currently while Pound continues falling. The Stoxx Europe 600 index added 0.2% led by basic resources shares. The Dax 30 was closed yesterday. France’s CAC 40 added 0.3%. UK’s FTSE 100 advanced 0.6% to 7375.54 despite data showing Britain’s economy sharply contracted in April due to the biggest fall in car production since records began.
Shanghai Composite leads Asian indexes rebound
Asian stock indices are rising today despite fresh threats from President Donald Trump to raise tariffs on imports from China. Nikkei closed 0.3% higher at 21204.28 with yen slide against the dollar accelerating. Markets in China are gaining: the Shanghai Composite Index is up 2.6% and Hong Kong’s Hang Seng Index is 0.8% higher. Australia’s All Ordinaries Index rallied 1.6% as Australian dollar continued sliding against the greenback.
Brent Up
Brent futures prices are edging higher today bolstered by expectations that major crude oil producers and OPEC will keep withholding supply. Prices fell yesterday: August Brent crude lost 1.6% to $62.29 a barrel on Monday.


