Get 40% Off
🤯 This Tech Portfolio is up 29% YTD! Join Now to Get April’s Top PicksGet The Picks – Just 99 USD

SPX To Reach 2400 By End Of Year

Published 12/02/2016, 05:46 AM
Updated 07/09/2023, 06:31 AM

On November 26th, I posted an article which outlined a hypothetical scenario of the S&P 500 Index reaching 2700 by the next U.S. Presidential election in November 2020.

I realize that this is only one of many possibilities that lie ahead for the SPX. However, given the aggressive economic, tax and fiscal agenda that President-elect Trump is currently promoting, it could, very well, materialize without too much resistance.

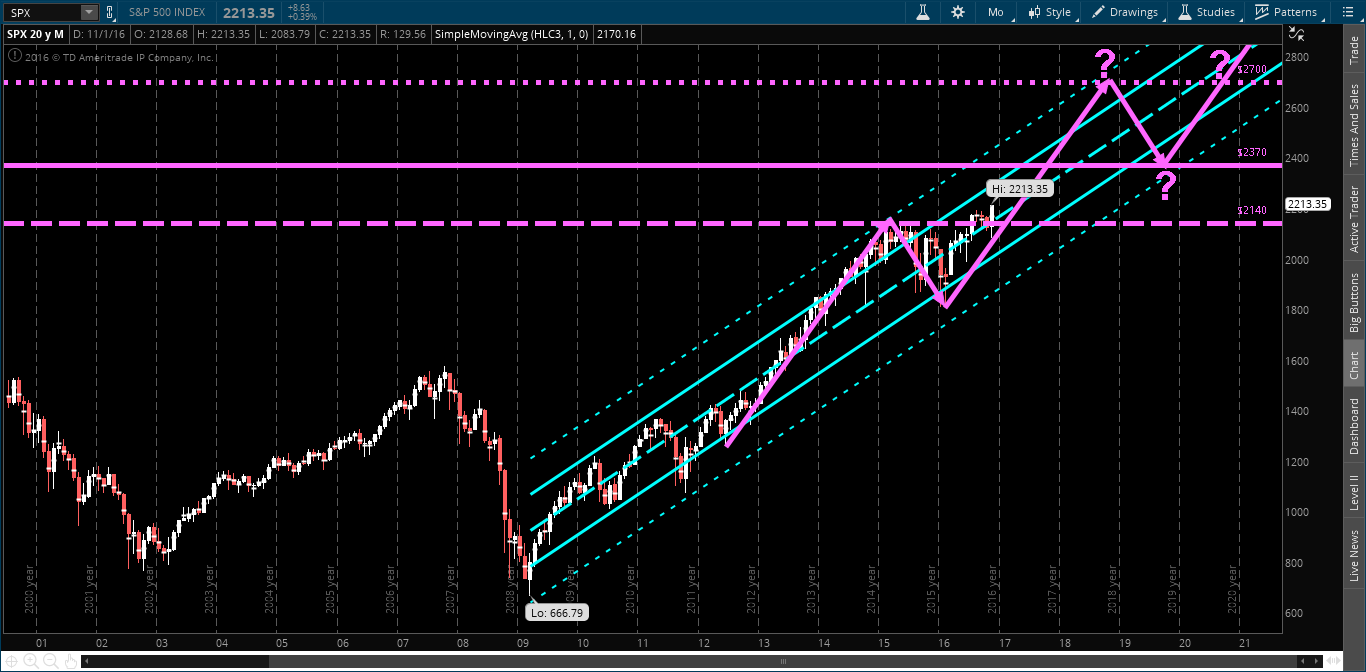
In keeping with the trajectory and velocity associated with that premise, I anticipate that the SPX could reach 2400 by the end of 2017, as shown on the monthly chart below.

Monthly SPX Chart

In last year's market outlook for 2016, I anticipated a rise of around 5-6% in equities, in general, in a run-up to this past November's Presidential election.

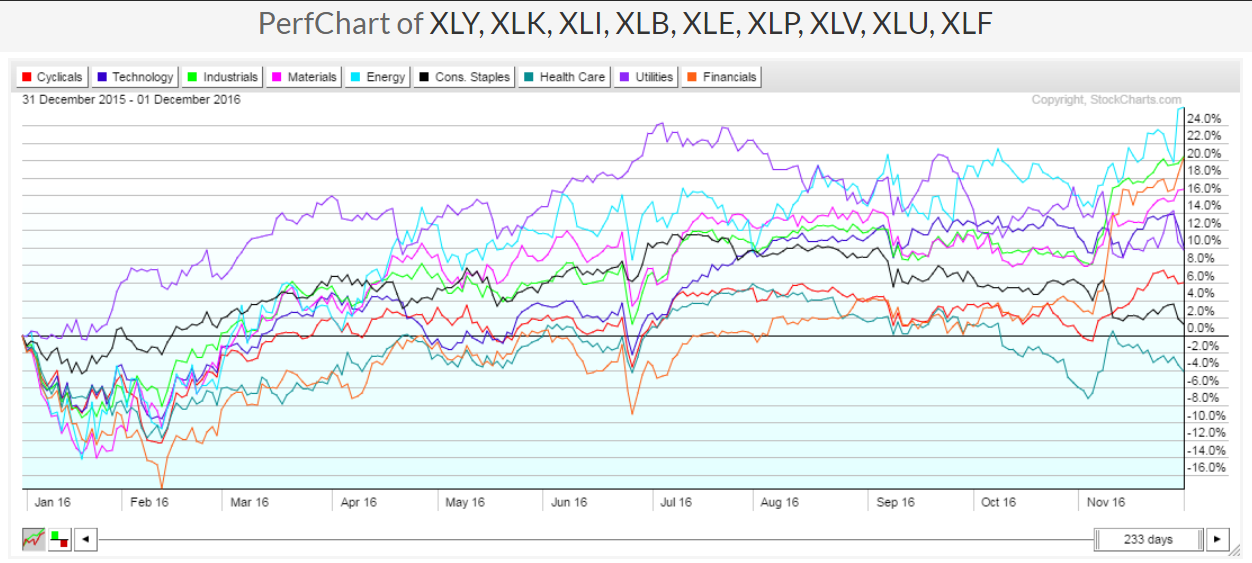
As of December 1st, you will see that the S&P 500 Index has gained 7.2% Year-to-date, as shown on the first graph below, while the Dow and NASDAQ Transport Indices and Russell 2000 Index have gained the most. The NASDAQ 100 Index has been the weakest.

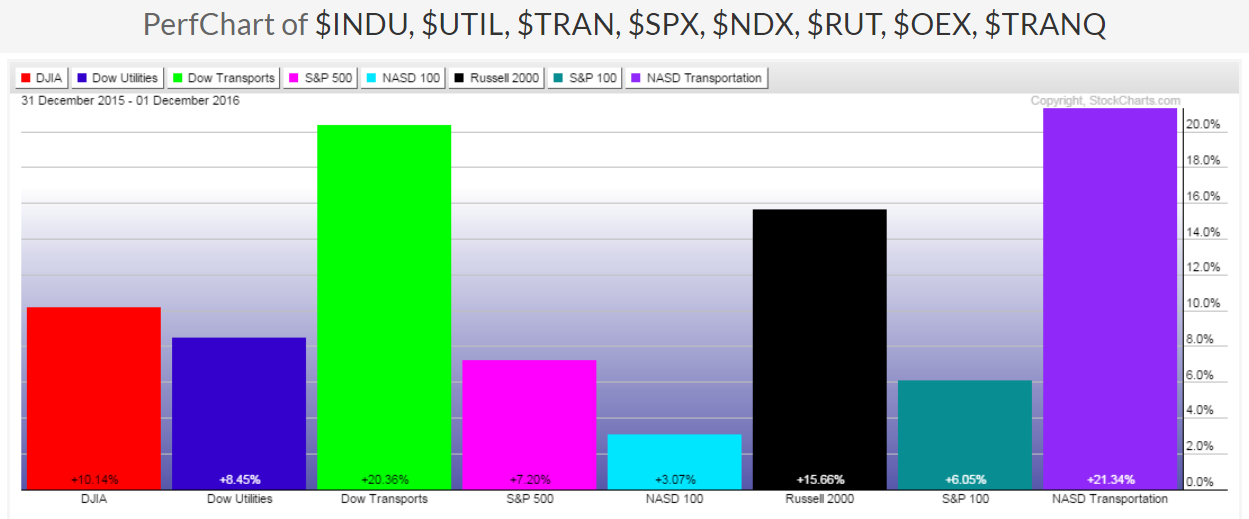
The second graph shows the steep rise of the Dow and NASDAQ Transport Indices and Russell 2000 Index from the day after the election.

SPX Gains 7.2% Year-to-Date
Dow, NASDAQ Transports, Russell 2000 Since Election 2016

The third Year-to-date graph shows the percentages gained/lost for the 9 Major Sectors.

Energy (NYSE:XLE), Industrials (NYSE:XLI), Financials (NYSE:XLF) and Materials (NYSE:XLB) have gained the most, while Consumer Staples (NYSE:XLP) has gained the least, and Healthcare (NYSE:XLV) has lost 4.16%, so far, this year.

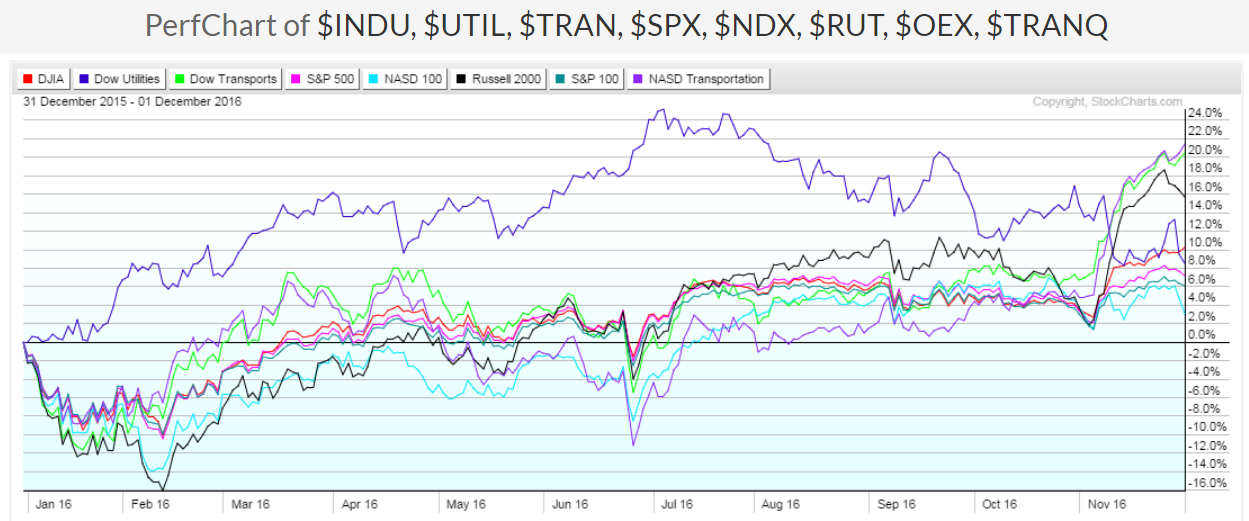
The last graph shows the steep rise of the Energy, Industrials, Financials and Materials sectors, and the decline of the Healthcare and Consumer Staples sectors, since the election.
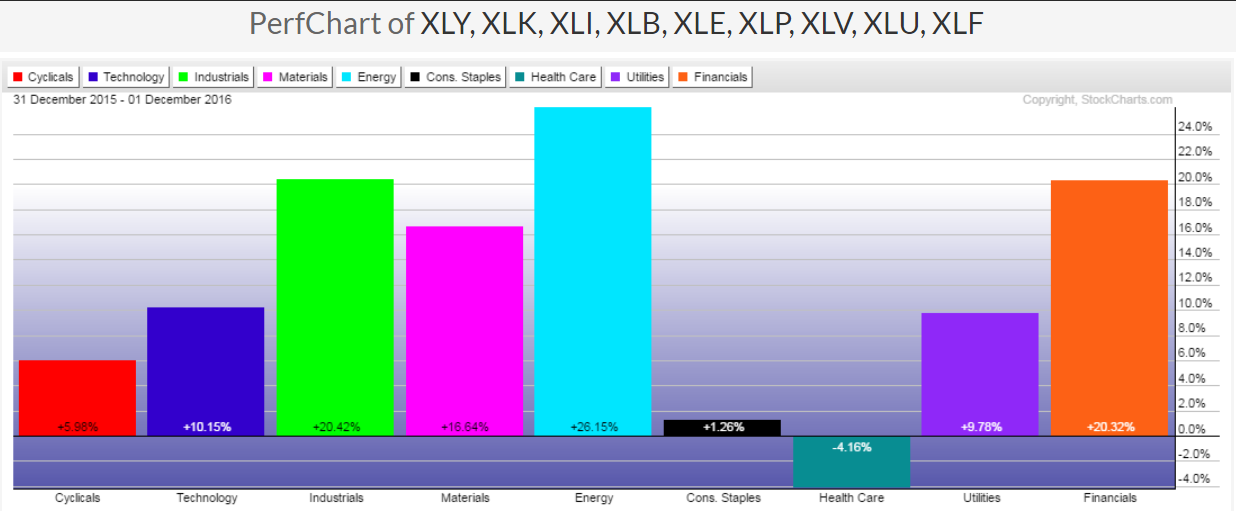
9 Major Sectors Gains and Losses
Steep Rise For Energy, Industrials, Financials and Materials

CONCLUSIONS

Assuming that volatility will be kept low (which can be monitored in a manner as described in my post of November 26th), I'd project that equity markets, in general, will gain around 11% in 2017. That would place the S&P 500 Index at just above the 2400 level by the end of the year.

In that regard, I think it will be important that Financials, Large-Caps and Small-Caps stay strong and that market participants continue to favour the riskier sectors over their more defensive counterparts. As well, I'd like to see Technology firm up and gain strength to support such a bullish outlook.

Latest comments

By the way, for those who have pooh-poohed the validity or value of my forecasts, I would, respectfully, mention that forecasting is a useful tool for any serious trader/investor to implement in order to track, assess and learn from one's future successes and failures on a short, medium, and long-term basis.
Misunderstening Candy u are a good painter wy will reach 2411 but not based on this graph and in point 2411 paint future.. best regards. a.s
I truly fail to see the predictive capabilities of statistics on the stock market when based on the stock market index itself. If presented with evidence about economic factors such as GDP, employment, unused investment capacity, etc... and that is used as an indicator then sure, let's predict that x, y, or z will reach 2400, but not just based on lines on a graph, sorry. Thank you.
we have huge bearish divergence on weekly on SPX ..
Risk Disclosure: Trading in financial instruments and/or cryptocurrencies involves high risks including the risk of losing some, or all, of your investment amount, and may not be suitable for all investors. Prices of cryptocurrencies are extremely volatile and may be affected by external factors such as financial, regulatory or political events. Trading on margin increases the financial risks.
Before deciding to trade in financial instrument or cryptocurrencies you should be fully informed of the risks and costs associated with trading the financial markets, carefully consider your investment objectives, level of experience, and risk appetite, and seek professional advice where needed.
Fusion Media would like to remind you that the data contained in this website is not necessarily real-time nor accurate. The data and prices on the website are not necessarily provided by any market or exchange, but may be provided by market makers, and so prices may not be accurate and may differ from the actual price at any given market, meaning prices are indicative and not appropriate for trading purposes. Fusion Media and any provider of the data contained in this website will not accept liability for any loss or damage as a result of your trading, or your reliance on the information contained within this website.
It is prohibited to use, store, reproduce, display, modify, transmit or distribute the data contained in this website without the explicit prior written permission of Fusion Media and/or the data provider. All intellectual property rights are reserved by the providers and/or the exchange providing the data contained in this website.
Fusion Media may be compensated by the advertisers that appear on the website, based on your interaction with the advertisements or advertisers.
© 2007-2024 - Fusion Media Limited. All Rights Reserved.