
After a brief hiatus, as I was on vacation with my family, the mini-series reviewing the seven most important stocks of the current market (Facebook (NASDAQ:FB), Apple (NASDAQ:AAPL), Netflix (NASDAQ:NFLX), Alphabet (NASDAQ:GOOGL), Microsoft (NASDAQ:MSFT), Amazon.com Inc (NASDAQ:AMZN) and NVIDIA (NASDAQ:NVDA)) continues. I am down to the last two, as I have already reviewed the following stocks, using Elliott Wave Theory (EWT) and technical analysis:
See my articles here:
Apple
Microsoft
Amazon
Google
Facebook
The 2nd to last review covers Netflix, Wall Street’s and the public’s online movie streaming, and content producing, global giant. Remember the days when you had to mail in your DVD? How things have changed. On to the charts, starting with the Monthly chart. See Figure 1 below.
Using EWT, I can count the rally into the 2011 price high as (blue) Primary-I and the low in late-2012 as Primary-II. NFLX went then on a tear, gaining almost 3000% (!) into the early-2018 high. It then consolidated for the next 15 months. The same period as the Primary-II correction. Since time- and price-symmetry matter, blue box, I, therefore, have labeled September 2019 as Primary-IV.
Figure 1
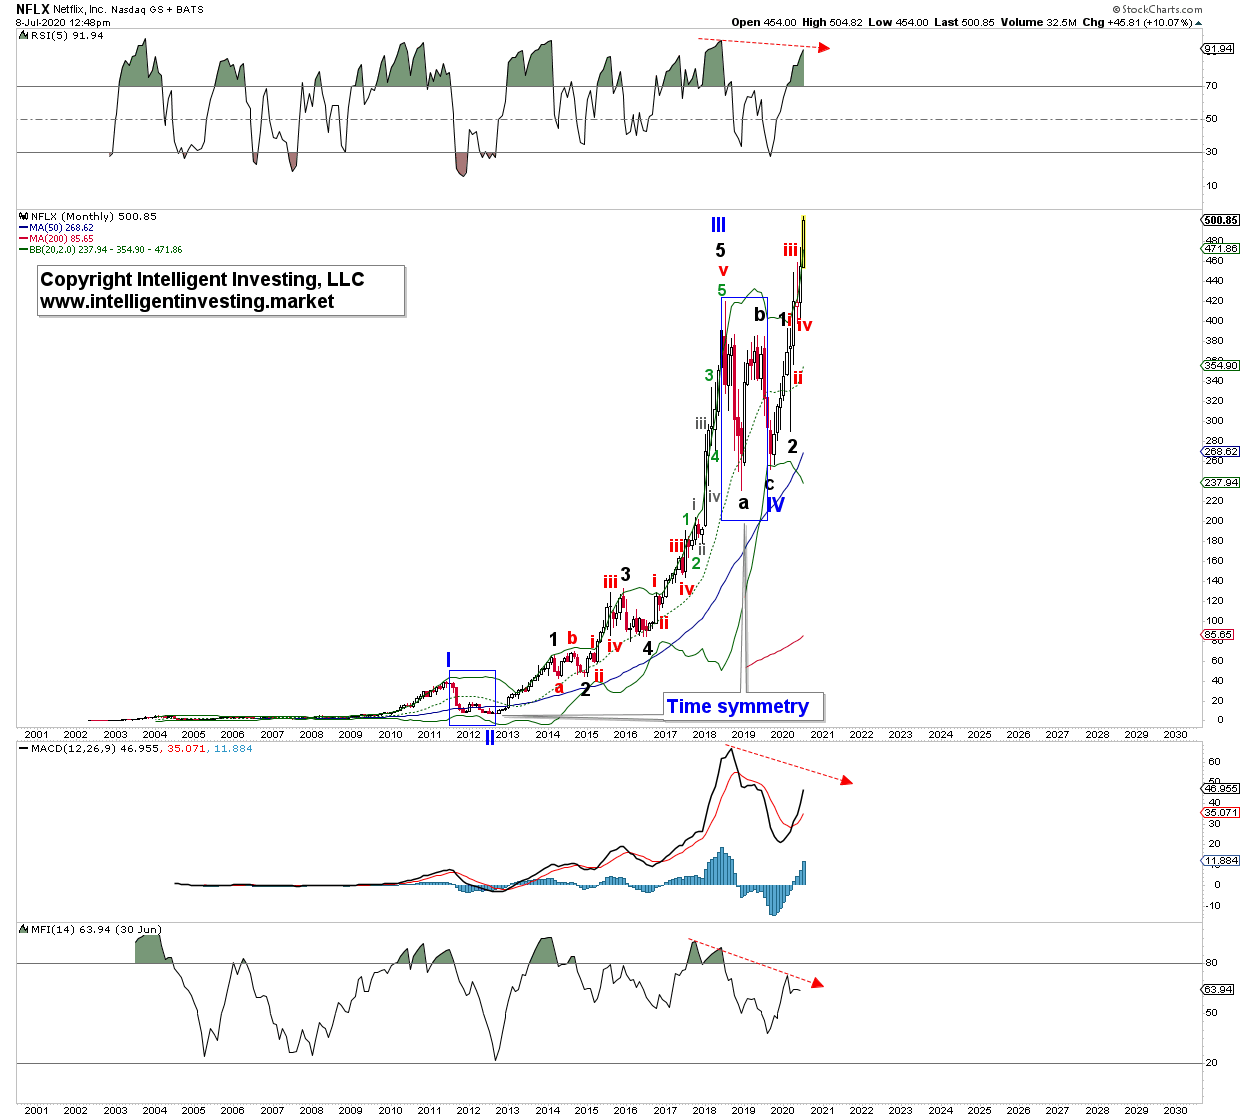
The Primary-IV price action also counts well as a corrective move (black a, b, c) from an EWT point of view. This price movement means Netflix is now, ideally in (red) intermediate wave-v of (black) major-3 of
(blue) primary V. Note, the negative divergences on the technical indicators, especially the Money Flow Index (MFI14). This divergence -on a monthly timeframe- is something you will see on all stocks I have
reviewed in this mini-series so far. It is a hallmark of the last wave up: less money flowing into this stock, the higher it goes. And money makes the world go round, they say. The weekly chart in Figure 2 below
shows the previously mentioned detailed EWT count clearer.
As you can see, Primary-IV completed at the 38.2% retrace of Primary-III. A quite common Fibonacci-retrace level for 4th waves. It then rallied in nine overlapping waves up to the February-2020 high: wave-1 of V. By late March it completed its wave-2 correction, and it is now in wave-v of 3 of V. 3rd waves often reach the 161.80% Fibonacci-extension, so, for now, I can only assume wave-3 will reach that high around $518+/-2). If wave-3 completes at around that level, the 4th wave falls typically back to prior support and the 100% extension of wave-1. In this case, that is about $430. Continuing with the textbook EWT count, we should then see the last rally to ideally $570 for a picture-perfect 5=1 relationship. Of course, Netflix can do something entirely different, e.g., its 5th wave can extend, like it did during Primary III: the rally from the mid-2016 wave-4 low to the early-2018 price high. It is impossible to know beforehand if that will happen or not. As such, all we can go by is standard impulse behavior.
But, (red) intermediate wave-iii topped in the 100-123.60% ideal target zone, which is typical for a 3rd of a 3rd wave. The subsequent (red) wave-iv stalled right at the textbook 76.40% level, also ideal for such a
wave-degree. It is, therefore, hard to say NFLX’s stock price is not following standard Fibonacci-based wave extensions and retrace.
Figure 2.
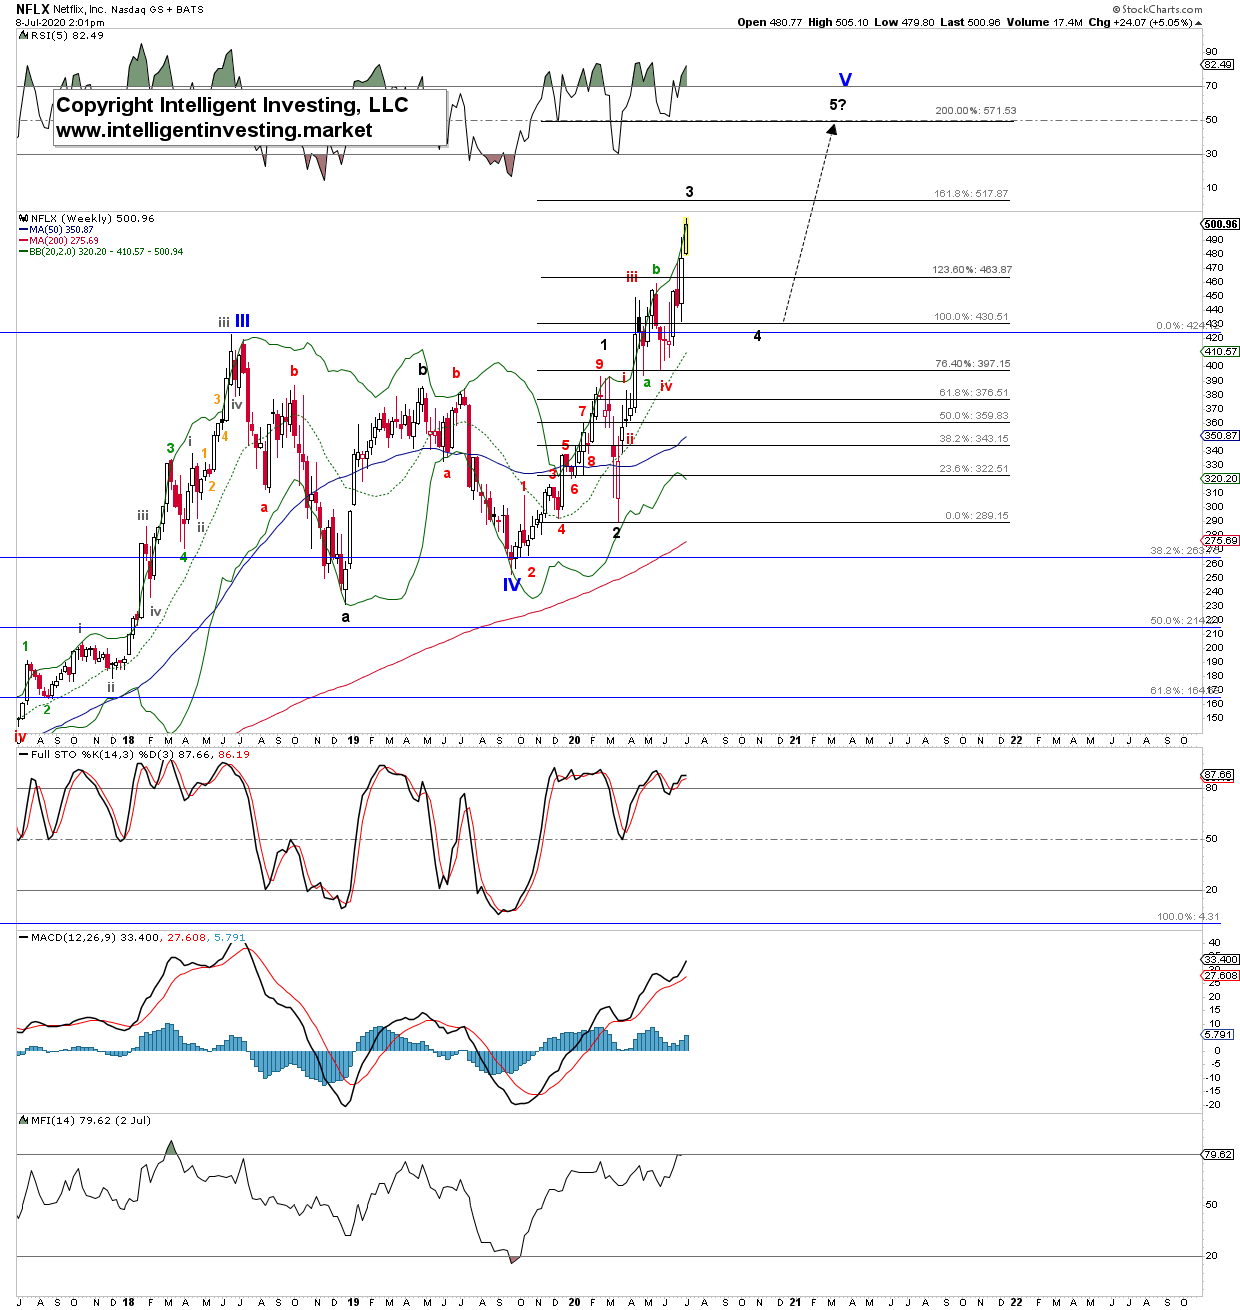
Bottom line, I expect a little more upside for Netflix, at around 4-5%, before it rolls over and starts a decent decline (~15-20%) lasting several weeks. From there, it should then stage a last multi-month rally gaining around 30-35%. Once that rally completes, Netflix has ideally completed five larger Primary waves up since its IPO in 2002 and should see one of its largest haircuts; think a move back to $135-220.
Sounds crazy?
Time will tell, but I put my faith, preferably, in the charts and not in opinion. As usual, please know your time frame when trading and investing in Netflix over the next few days, weeks, months, and years.