In this mini-series, I would like to review the seven most important stocks of the current market using Elliott Wave Theory (EWT): Facebook (NASDAQ:FB), Apple (NASDAQ:AAPL), Netflix (NASDAQ:NFLX), Alphabet (NASDAQ:GOOGL), Microsoft (NASDAQ:MSFT), Amazon (NASDAQ:AMZN) and NVIDIA (NASDAQ:NVDA).
Why are they the most important?
Because their combined market cap sits at over $4.2 trillion, which is between the GDP of Germany ($3.5 trillion) and the GDP of Japan ($4.9 trillion). Think about that: seven companies combined are now as valuable as entire major global economies. Only five of these seven (AAPL, AMZN, FB, MSFT and GOOGL) stocks now account for almost 25% of the S&P 500 market cap, exceeding the 18% concentration level reached during the dot-com bubble.
In 2017, the first four “only” made up 10% of the S&P500. The increase is because the SPX is market-cap weighted: the larger a company’s market cap, the more substantial part its stock becomes of the entire index.
The saying “Apple is the market” is, therefore, not far from the truth. Thus, it pays dividends knowing what these stocks are most likely going to do over the near to long-term if one is interested in the
direction of the major indexes.
Why?
Because they will affect the direction of the major U.S. indexes, such as the NASDAQ Composite, Nasdaq 100 and S&P500.
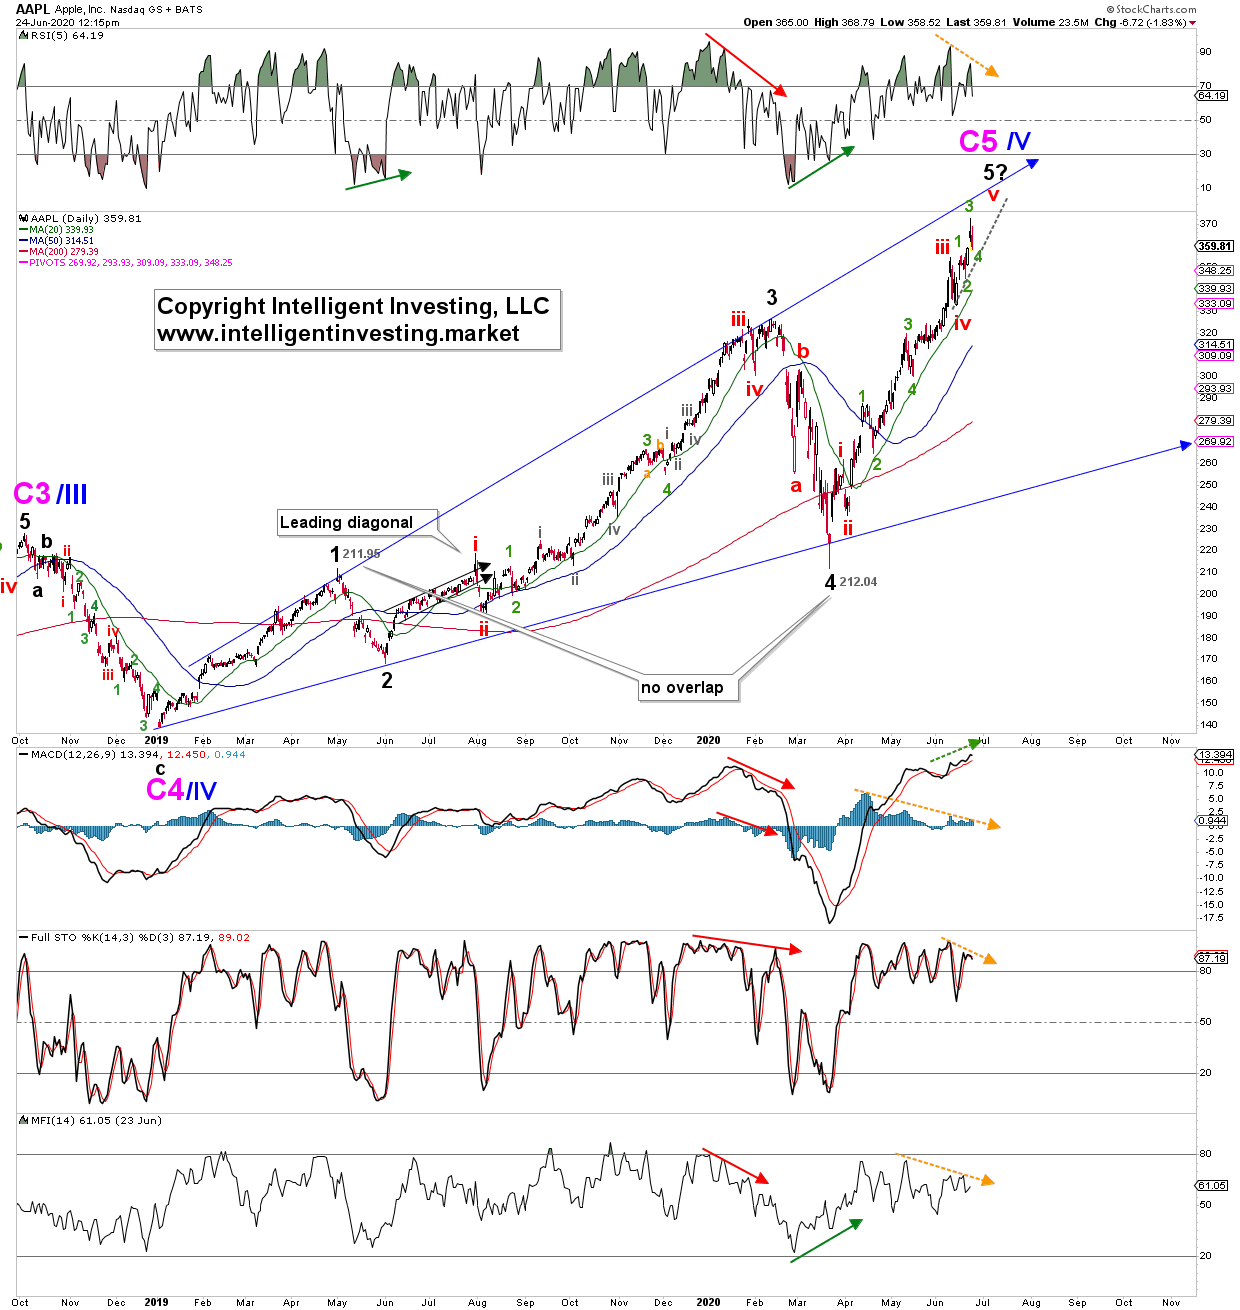
I would like to kick-start this mini-series with everybody’s darling: AAPL. First, up is its daily chart since October 2018. Using Elliott wave, I can count five waves up off the December 2018 low. In EWT, 1 st and 4 th waves are not allowed to overlap in a standard impulse (only in a diagonal).
As you can see, AAPL bottomed on March 23, only 9 cents above the May 2019 top. Since that infamous low, AAPL has rallied – and the NAS/NDX with the SPX to a lesser extend – to new ATHs in a classic impulse pattern as well. Now, it is completing its last few scribbles higher, but it is not necessary. Note the dotted orange arrows on the technical indicators: negative divergence. Like late-2019 into early 2020 (solid red arrows). Such divergences mean a top is most likely pending. Ideally, on a tag of the upper blue trend line (for green wave-5) but it is not necessary. What does that top mean longer-term?
 Using the log-scale chart for AAPL since its IPO in 1984, see Figure 2 below, I can count three Cycle waves (pink C3) up off the low made in 1985. This EWT count means a Cycle-4 wave is expected. Since 4 th waves often fall back to the price level of the prior one-degree-lower 4 th wave we could see a correction back to the $170-210 level, possibly as low as $140. Since everybody is bullish AAPL, my call may be refuted by arguments based on fundamentals. But the EWT count is what it is, and in the end, all that matters is price. Price is the final arbiter, not the amount of profit or loss a company generates.
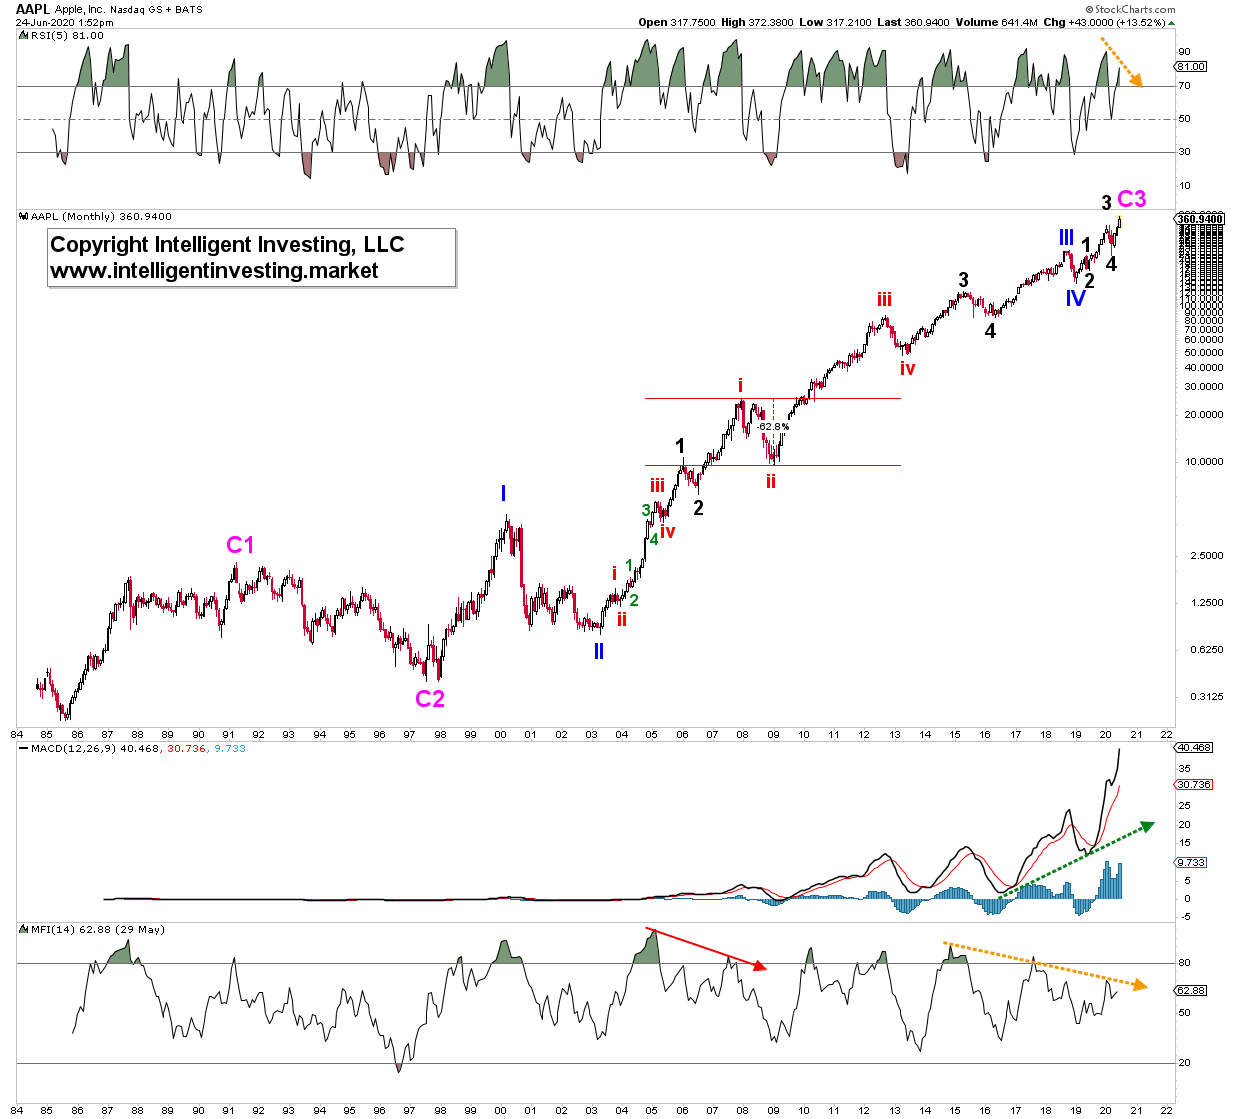
Please note the negative divergences building on the monthly RSI5 and especially the Money Flow Index (MFI14). Since liquidity is a significant driver, it is a warning sign that since 2015 less and less money is put into AAPL (on a monthly timeframe), the higher price went. Compare this, for example, with the 2004-2007 timeframe: solid red arrow. AAPL then lost over 60% of its value during the 2008-2009 market crash. Not shown here, but each significant correction (C2, II, 2, i, ii, iv, 4, IV, 4) in AAPL ranged between 35 to 85%. It is, therefore, not such a wild forecast to expect something along those lines now. Even a move back to the $170 level would be a ~55% correction and still perfectly normal for AAPL.
Thus, currently, the technical indicators are aligned with the Elliott wave count. Often that is a good indication the Elliott wave count is correct.
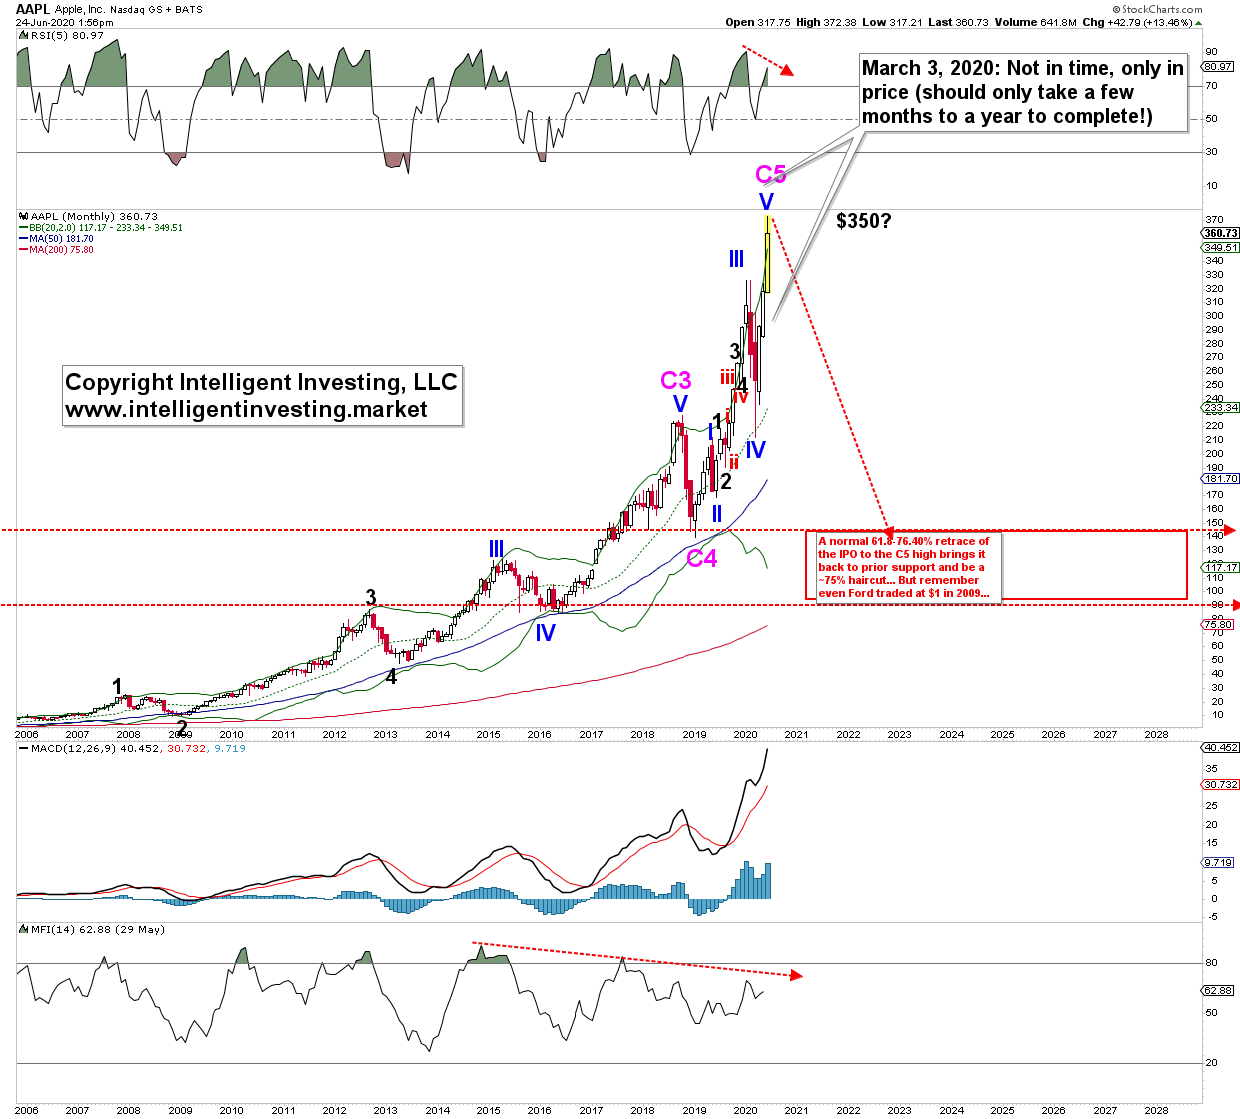
However, the bulls are not out of the woods yet in case they might think the $140-170 zone will be an excellent buy level, as I can even count the entire advance off the 1985 low as complete: A Cycle 5. See figure 3 below.
Already on March 3, I expected AAPL to reach around $350 for a significant-top, and so far, it got to $372. Not too shabby a forecast if I may say so myself. The monthly chart below shows the
extreme move up off the March low. Typical for a 5 th wave. Extended price moves like these are hard to nail down for an exact top as sentiment is exuberant and can help push price beyond regular Fibonacci extensions. For now, a lower monthly close in July will solidify the negative divergences on the monthly technical indicators and help confirm a correction, likely much more substantial than most anticipate, is under way.