
Yesterday, I started this mini-series of reviewing the seven most important stocks of the current market using Elliott Wave Theory: Facebook (NASDAQ:FB), Apple (NASDAQ:AAPL), Netflix (NASDAQ:NFLX), Alphabet (NASDAQ:GOOGL), Microsoft (NASDAQ:MSFT), Amazon (NASDAQ:AMZN) and NVIDIA (NASDAQ:NVDA). I started with an analysis of the largest stock by market cap: Apple ($1.572 trillion). See my article here.
Moving down the market-cap totem pole, and I find Microsoft at $1.504 trillion. The largest software company in the world had its Initial Public Offering in 1986. Like almost all technology stocks, it peaked in 2000. But contrary to many other stocks that bottomed in 2003, like Apple, it did not bottom until 2009. From an EWT perspective, this means wave-I topped in 2000, and wave-II bottomed in 2009. See Figure 1 below.
Since then, Microsoft has been on a parabolic rise until February of this year (red line). It then lost about 30% of its value by late-March only to be followed by an even more parabolic rise going into today. The blue dotted lines show my projections of early 2020, and so far, MSFT has adhered well. Vertical lifts like MSFT is experiencing now are often (final) 5 th waves in EWT, aka blow-off tops.
Figure 1
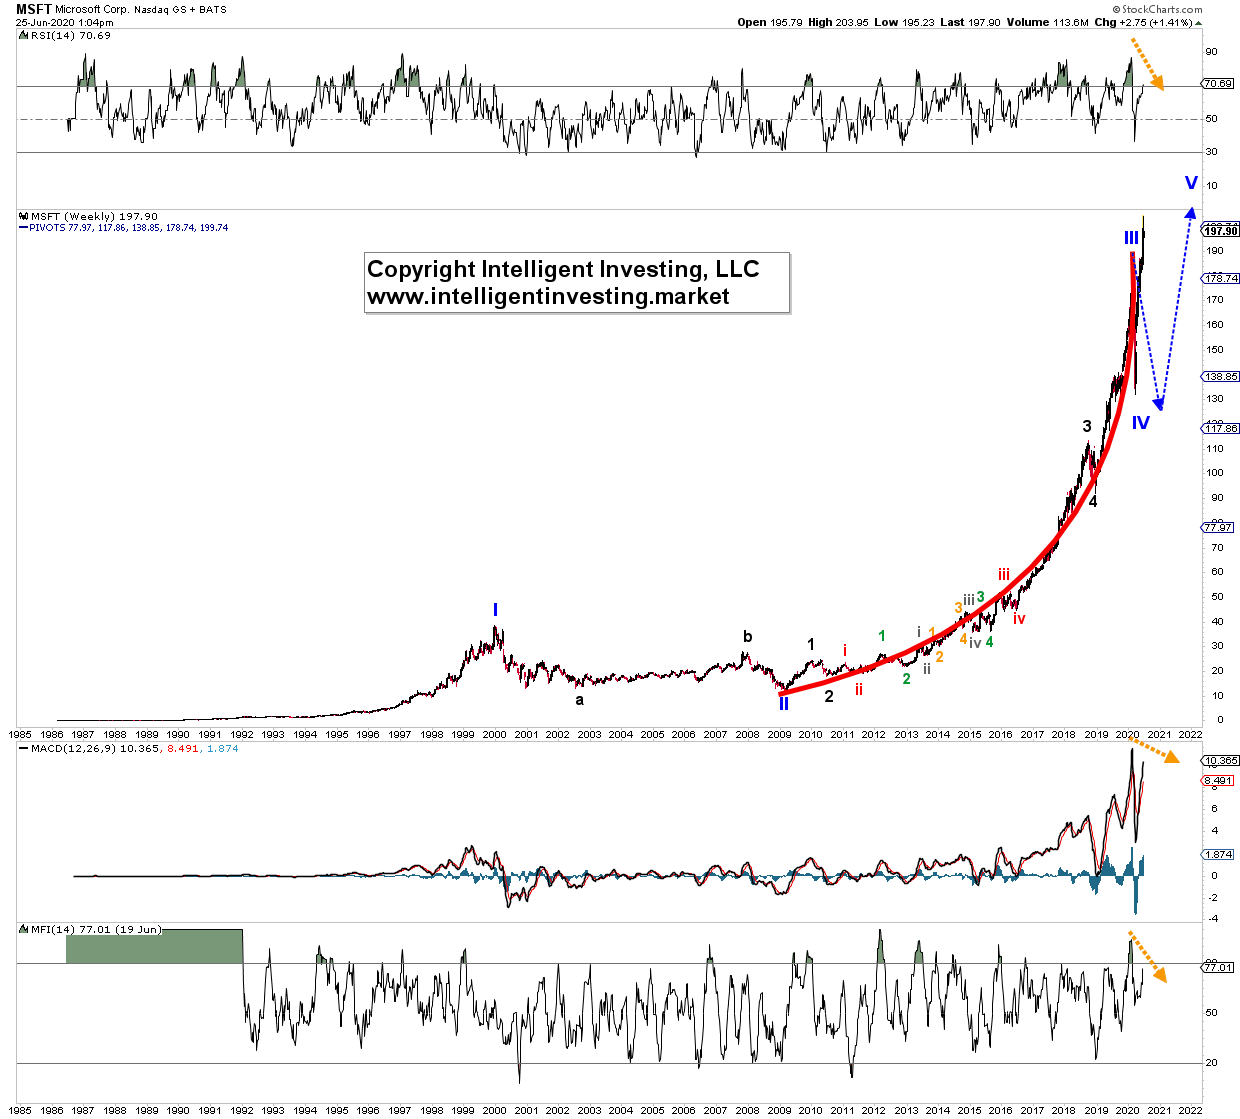
The weekly chart’s technical indicators show potential negative divergences (orange dotted arrows). Although divergence is only divergence until it is not, it must be noted. And it fits with the EWT pattern of the last wave higher on weaker momentum. Of importance is, IMHO, the lower Money Flow Index (MFI14): less money is moving into Microsoft at these levels compared to before the February top. This pattern was also evident for Apple. Since liquidity is a significant driver, it is a warning sign.
Zooming out to the monthly time frame, I can count 2000 and 2009 instead also as a Cycle-1 and -2 wave. See Figure 2 below. The cycle-wave is one-degree higher than that shown in the weekly chart. It implies the current pending top is “only” Cycle-3, and Microsoft should ideally drop back to around $130-150 for Cycle-4 before a final rally to new all-time highs (ATHs). Note the “$195?” label. I have had this as my upside target for many months now. Microsoft has so far traded as high as $204. Not too shabby a forecast if I may say so myself. Especially since extended price moves like these blow-off top 5 th waves are hard to nail down as sentiment is exuberant and can help push the price beyond regular Fibonacci extensions.
Figure 2.
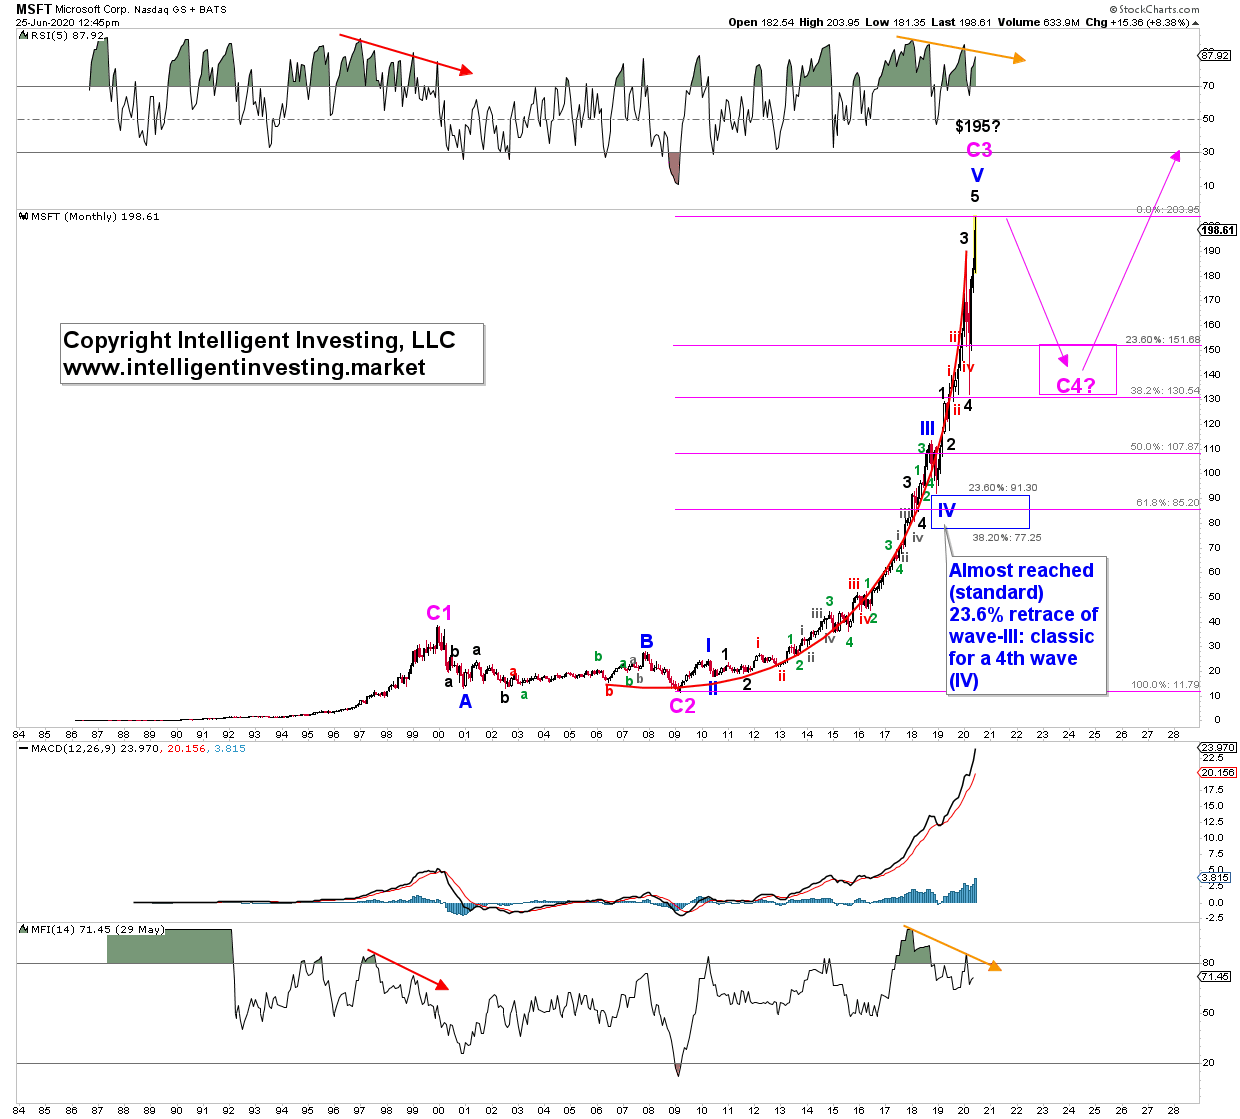
Like on the weekly chart, also the technical indicators on the monthly time frame are potentially negatively diverging except for the MACD. The latter is not necessary since it did not diverge in 2000 either, for example. Instead, the divergence on the monthly RSI5 and Money Flow Index is like the run into the price high made in 2000 (red arrows). These setups add weight to the evidence of a similar degree wave in the making but can take time. A lower close in July will cement this setup even more.
Since EWT is often more an art than an exact science, I am left with two options:
– The weekly chart suggests the entire rally since Microsoft's IPO is coming to an end.
– The monthly chart suggests “only a 25-35% haircut” before moving higher one las time.
I cannot tell you which it will be with all certainty, but both do point out the upside reward may not outweigh the downside risk any more. A move and close below $130 will shift the odds in favor of the EWT count shown on the weekly chart, and then I expect $100 +/- 15 to be reached for a more meaningful (bounce) bottom.