One week ago, FactSet revealed that 250 of the stocks in the S&P 500 had dropped more than 20% from all-time peaks. The index itself, however, had only declined a modest 5% from its record top.
Today, there are more indications of market distress. The Russell 2000, a popular small cap barometer, has dropped 13% from its high. The Dow Jones Transportation Average has fallen 13% as well. And the Financial Select Sector SPDR (NYSE:XLF) is sitting at a 52-week low.
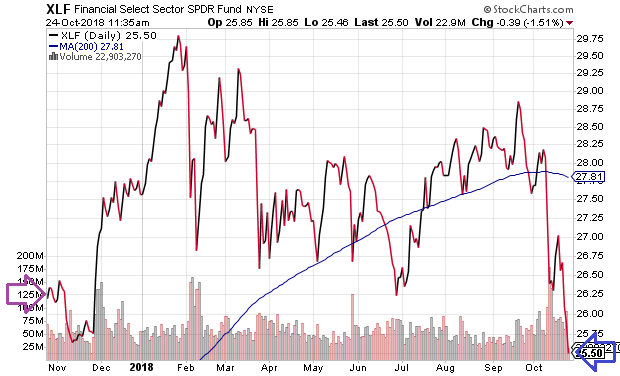
Theoretically, shares of financial institutions should perform well when the economy is firing on all cylinders. However, the investment community is expressing concern about higher interest rates and the credit risks associated with outstanding loans.
Is another financial crisis lurking? That depends on one’s perspective on developments abroad.
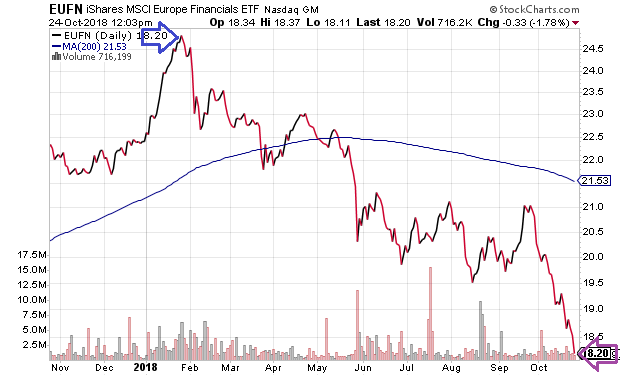
For example, Italy’s battle with the European Union has revived fears about bank exposure to Italian sovereign debt. The iShares European Financials ETF (NASDAQ:EUFN) is down 26.5% from its 52-week high water mark.
In contrast, price depreciation for U.S. assets has largely coincided with a “hawkish” Federal Reserve. Chairman Powell and committee member colleagues appear resolute in hiking the overnight lending rate four more times by the end of 2019.
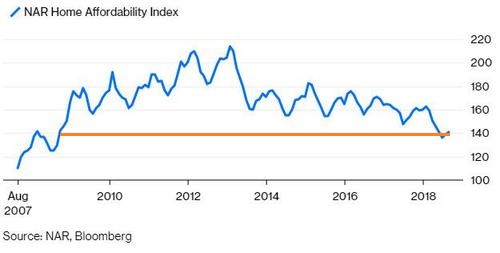
On the surface, pushing the Fed Funds Rate (FFR) from the 2% level to the 3% level across a 12-month span may not seem like a big deal. On the flip side, the shift from zero percent rate policy to where we currently stand (2%) has adversely impacted mortgage rates and home affordability. The latter is at a 10-year low.
Another concern may be profit margins. When one couples higher borrowing costs with higher labor costs, U.S. dollar strength and tariffs, it is not too difficult to forecast deceleration in U.S. corporate profit growth.
It follows that some of the volatility and rapid-fire selling of stock assets relate to investors rethinking valuations. For instance, year-over-year earnings growth comparisons lose the tax-cut benefit in the first quarter of 2019. Higher overall costs are likely to hinder profitability. And previous claims regarding a low-rate justification for exceedingly high stock valuations falls by the wayside.
At present, market internals look horrendous. Nearly one-quarter of securities trading on the NYSE have hit 52-week lows. In fact, the New York Stock Exchange High-Low Index has not pointed to market breadth this troublesome since the world’s central banks (e.g., Bank of Japan, European Central Bank, etc.) injected trillions of quantitative easing stimulus into the global financial system nearly three years ago.
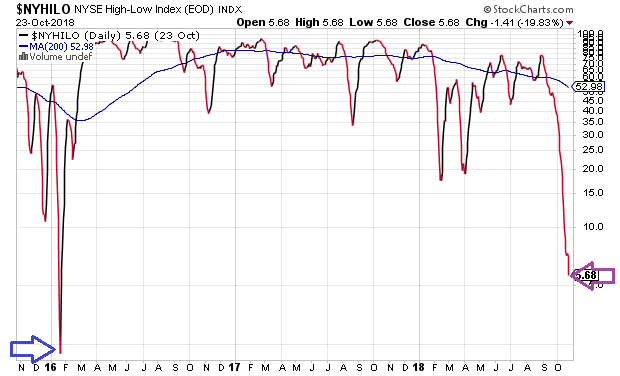
Back then, the U.S. Fed backed off its four rate hike plan for 2016 by telegraphing an intention for a single year-end hike. The markets rejoiced. Today, the U.S. Fed is decidedly in favor of regular rate hikes and shows little indication of capitulating to critics.
Back then, the world’s central banks were willing to create trillions of currency credits to push bond yields lower, even negative. Today? None of the world’s influential central banks are discussing emergency stimulus measures.
Granted, there may be little evidence of a U.S.-based recession in sight. Nevertheless, decreasing liquidity, tighter credit and asset price depreciation themselves can bring about recessionary pressure.
Not sure about that? Then you may have a short memory.
A bursting of the technology stock bubble preceded the 2001 economic downturn. It came about in a Fed tightening cycle. Meanwhile, the popping of the residential housing balloon preceded the Great Recession. It occurred after the Fed kept rates too low for too long, before slowly hiking rates 17 times to a level that it considered “neutral.”
So here we are again. Asset prices are falling or flat-lining at a time when the overwhelming majority of economists and Fed committee members see nothing but blue skies for years to come.
Me? I see speculative behavior in clients that remind me of when I co-hosted a national talk radio show in 1999. Then, callers peppered me with inquiries about the New Economy’s dot-com revolution. What did I think about Cisco (NASDAQ:CSCO), JDS Uniphase (JDSU) and Sun Microsystems (SUNW)? Now clients are interested in cryptocurrencies like bitcoin and cannibis stocks like Tilray (NASDAQ:TLRY).
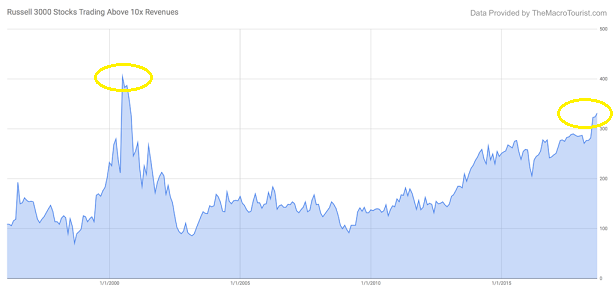
Even when we step outside of the crazes that emulate a MegaMillions lottery, the notion of normal seems skewed. Right now, there are are more U.S. stocks trading at insane price-to-sales ratios of 10x revenue than at any moment since the 2000 tech top.
I am not advocating a panicky run for the exit on all of one’s holdings. That said, I see every reason to be patient with a larger-than-usual percentage allocation to cash equivalents.
