In my previous week’s commentary, I explained why higher interest rates will hurt stock assets more than many might think. Naysayers pointed to the fact that rate levels are still quite low on a historical basis. Unfortunately, these folks are neglecting to place their comprehension of borrowing costs in context.
Take a look at the last 20 years of U.S. monetary policy via the Federal Funds Rate (FFR). The Federal Reserve’s tightening phase from the 4% level up to the 6.5% level pricked the tech bubble in 2000. In turn, dramatic stock losses alongside dot-com pandemonium led to massive layoffs across the corporate landscape. The 2001 recession followed.
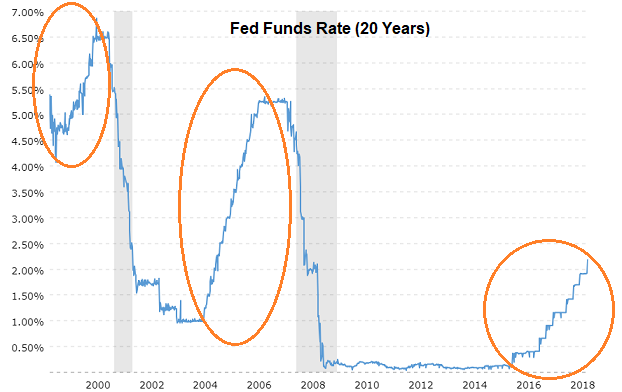
The Federal Reserve’s response to the 2001 recession was to lower the FFR more than 500 basis points. Committee members then kept the overnight lending rate too low for too long, encouraging an environment that matched irresponsible borrowers with unscrupulous lenders.
What happened next? The housing balloon burst, stocks cratered, subprime mortgages ravaged the financial system, millions lost their jobs and the Great Recession slammed the economy.
As if “too-low for-too-long” wasn’t bad enough, the Fed double-downed on economic stimulus. Leaders dropped the FFR more than 500 basis ponts once again. They also incorporated emergency measures (a.k.a. “quantitative easing” and “QE”), keeping them in place for six years alongside zero percent rate policy. Only recently did they begin attempting to remove ultra-easy accommodation.
The implications are threefold:
(1) With interest rates, relativity matters. Ever-lower borrowing costs correspond to the amount of total debt that must be serviced. For example, when keeping asset appreciation (or depreciation) constant, a 4% mortgage (2010s) for a primary residence that goes along with 17% mortgage debt servicing is inferior to a 10% mortgage (1980s) for a primary residence that goes along with 12% mortgage debt servicing.
Talk to anyone in the home building business and ask them if they’re excited about today’s 5% 30-year fixed. If absolute rates mattered, they’d be ecstatic that mortgages are still half what they were in the 1980s. Yet real estate prices have rocketed, affordability is being stretched, and home builder stocks reflect lousy forward prospects.
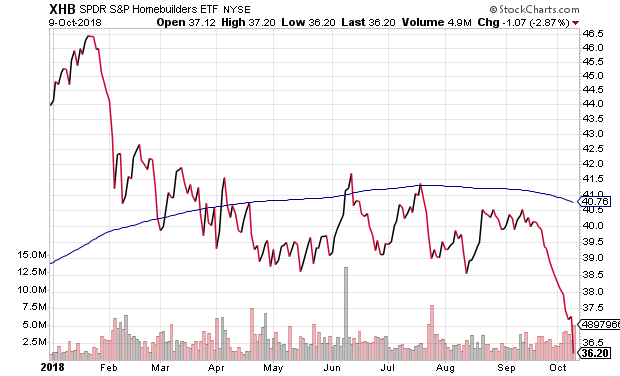
(2) “Way-too-low-for-way-too-long” Fed policy is creating problems for all major asset types.
Some investors may be scratching their heads. Why has the Dow dropped 800 points?
Perhaps they’re asking the wrong question. Rather, why hasn’t it happened sooner?
Developed international stocks, emerging market stocks, bonds, precious metals. All have been noticeably negative on the year. And the losses continue to mount.
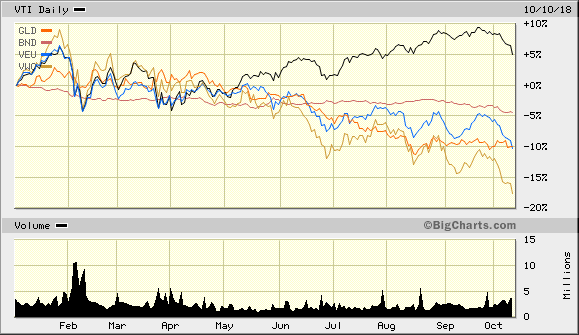
Fed tightening has meant a stronger dollar, hurting the prospects for gold and foreign currencies. The higher borrowing costs have also had a dire effect on overseas corporations that have been borrowing in dollars, and now find themselves having difficulty with debt servicing.
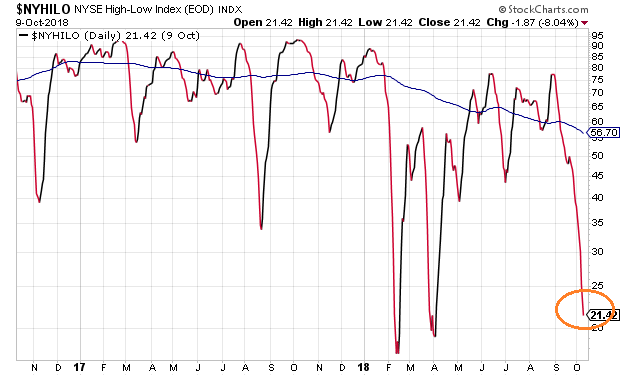
“U.S. stocks are still doing well on the year,” you counter. That is the case, yes. Yet weakness in market internals appear to be indicating that U.S. stocks will have difficulty maintaining a pristine image.
For instance, the New York Stock Exchange High-Low Index is showing that there are more U.S. securities hitting new lows than new highs. Readings below 50 indicate that market breadth is decidedly poor.
(3) When borrowing costs are manipulated far too low for far too long, a favorable pace and desirable amount of tightening is nearly impossible to determine.
Enthusiasm for U.S . economic might has obscured a global economic slowdown. Combine services and manufacturing all around the world and one sees global economic output at 2-year lows.
Granted, the Global PMI above 50 means that it is still expansionary. Nevertheless, monetary stimulus from foreign central banks is either waning or being kept at the same levels. Meanwhile, the Fed’s rate hiking path is causing foreign borrowers to toil with debt difficulties, either because dollar-denominated debt is becoming more costly or because foreign yields are being pulled higher.
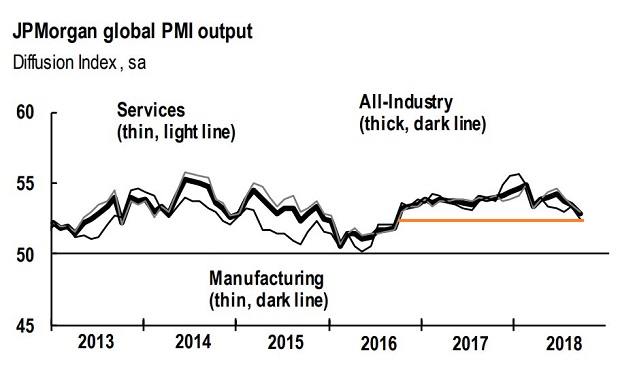
Perhaps ironically, there are no major tax reform packages abroad. Additionally, tariffs and trade spats may be taking a toll.
Bottom line? While I will maintain an allocation to U.S. equities for my clients as long as the monthly close on the 10-month simple moving average is above its trendline, we have been raising a fair amount of cash throughout the year.
Where have those dollars gone? Cash equivalents. Specificially, we use a variety of ultra-short term exchange-traded trackers like JPMorgan (NYSE:JPM) Ireland ICAV - USD Ultra-Short Income UCITS ETF USD dist (MI:JPST), PIMCO Enhanced Short Maturity Active Exchange-Traded (NYSE:MINT), Guggenheim Enhanced Short Duration (NYSE:GSY).
Disclosure Statement: ETF Expert is a web log (“blog”) that makes the world of ETFs easier to understand. Gary Gordon, MS, CFP is the president of Pacific Park Financial, Inc., a Registered Investment Adviser with the SEC. Gary Gordon, Pacific Park Financial, Inc., and/or its clients may hold positions in the ETFs, mutual funds, and/or any investment asset mentioned above. The commentary does not constitute individualized investment advice. The opinions offered herein are not personalized recommendations to buy, sell or hold securities. At times, issuers of exchange-traded products compensate Pacific Park Financial, Inc. or its subsidiaries for advertising at the ETF Expert website. ETF Expert content is created independently of any advertising relationship.
