
Stock market bearishness is practically extinct. You would have to travel back in time to 1987 to find a greater level of disparity between investment adviser bulls (64.4%) and bears (13.3%).

The mainstream media continue to fuel the enthusiasm for equities by touting desirable tailwinds, including tax cut-led economic growth, low inflation and full employment. Indeed, these conditions are favorable for the time being.
What the mainstream media are missing, however, is the nature of asset bubbles themselves. Specifically, asset balloons rarely deflate slowly. They tend to burst. And when they do, recessionary pressures develop in the economy, making it more difficult to patch holes in the latex.
For example, there were precious few well-regarded analysts and economists at the turn of the century who believed that the stock market was in danger of collapsing or that the economy itself was in danger. On the contrary. Virtually every prominent voice advocated that stocks deserved ridiculously high valuations because of “New Economy” particulars (e.g., strong economic growth, low inflation, full employment, etc.).
When the dot-com tech bubble exploded in March of 2000, an obvious catalyst did not exist. In fact, the most that anyone might claim is that the Federal Reserve had been raising overnight lending rates between the Asian currency crisis lows of 1998 (4.75%) to the 2000 May highs (6.5%). Some could argue that the Fed went too far, and should have stopped its tightening campaign long beforehand.
So the bursting of the 2000 tech bubble would not have occurred and the NASDAQ would not have registered -76% (3/2000-9/2002) had Fed officials been savvy enough on rate policy? Really? If you believe that, then you’re making my point for me; that is, central bank policy error is a ubiquitous threat whenever an asset balloon exists.
Today, stocks are egregiously overvalued on a dozen popular measures, from regression-to-the-trend to price-to-sales (P/S) to price-to-earnings (P/E) to the Warren Buffett Indicator (market-cap-to-GDP). Without question, it is becoming more difficult to argue that the current asset price balloon does not share many similarities with March of 2000.


Couldn’t one say that the employment landscape is favorable for stocks? Perhaps. Then again, the stock asset bust in March of 2000 led to layoffs, a reduction in employer/consumer spending and less willingness to add to debt. Stocks had fallen into a severe bear market long before the economy had entered a recession 12 months later in March of 2001.
Keep in mind, the 12-month moving average for the unemployment rate (U-3) correlates highly with recessions. And while we may not have seen the moving average trough yet, a 4% U-3 unemployment rate is not too dissimilar from the full employment circumstances leading into both the 2001 recession and 2008’s Great Recession.

In a similar vein, housing prices had peaked in 2006. They began declining in 2007. Yet going into 2008, few mainstream economists or analysts were definitively predicting a recession, let alone a financial crisis for the ages. The housing bubble had burst and the stock market had begun its bearish descent (10/07) long before anyone recognized that the recession had already started.
It is worth noting that the National Bureau of Economic Research did not acknowledge that a recession began in 12/2007 until 12/2008. How might the top economists in the world have done a better job forecasting and identifying economic contraction? Perhaps they might have taken into consideration the moving average trough for the unemployment rate (above) in addition to yield curve inversion (below).
Speaking of yield curve inversion, few at the Fed express concern that we are two rate hikes away from the probability that 10-year yields will be lower than 2-year yields. There is only a 50 basis point difference between them at present. For that matter, the minuscule 30-point spread between the 30-year yield and 10-year yield is another inversion point that is worthy of attention.

Again, a bursting of the technology stock bubble preceded the 2001 economic downturn. Meanwhile, the popping of the residential housing balloon preceded the Great Recession.
Why are these facts important? First, while we may not know when the current bubble will rupture, it almost assuredly will. Secondly, it is foolhardy to assume that you will see the recession on the horizon prior to a bubble bursting, and then reduce your stock allocation at the perfect moment. Truth be told, it is the rupturing of the rubber that will foster contraction within the economy, and not the other way around.
One should recognize that asset bubbles precede and contribute to higher unemployment, lower consumer purchasing power as well as corporations battening down their hatches. In so doing, it becomes more critical to identify the conditions and presence of the asset balloons themselves. I would not discount the valuation euphoria surrounding Facebook (NASDAQ:FB), Amazon (NASDAQ:AMZN), Netflix (NASDAQ:NFLX) and Google (NASDAQ:GOOGL) (FANG). Nor would I ignore the valuation exuberance associated with cybersecurity, cannabis and cryptocurrencies.
These areas – FANG, marijuana, blockchain, cyber – may all be wonderful investment opportunities when their prices are lower and their valuations come back to earth. Nevertheless, investing in something because it operates in a high-growth space does not imply that an exceedingly high price paid generates impressive returns going forward. After all, there is a reason that the most successful investors, Warren Buffett included, prefer to sell higher and buy lower.
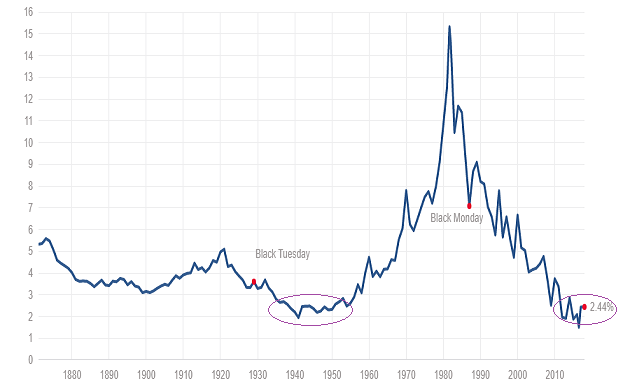
Inevitably, someone will proclaim that low interest rates are the reason that “this time is different.” Two things that demonstrate why this notion is far from sacrosanct. First, the same low cost of capital existed for 20 years between 1935 and 1954. And yet, stock valuations were HALF what they are today. In other words, low interest rates did not “justify” higher stock valuations in the previous 20-year period.
Second, the Federal Reserve’s easy money policies (1935-1954) still did not prevent bear markets from occurring in 1937-1938 (-49.1%), 1938-1939 (-23.3%), 1939-1942 (-40.4%), or 1946-1947 (-23.2%). If the Fed was not able to backstop financial markets in these previous decades – if the central bank was not able to stop the carnage in 2000 or 2008 – why would anyone have endless confidence in central bank policy perfection going forward?

“But Gary,” you remind me. “Over the last decade, global central banks have electronically created the money equivalent of $14 trillion dollars, and then they bought gobs of financial assets. They have changed the supply-demand equation of free markets.” Without a doubt, there is truth in the observation.
On the flip side, the reality goes a long way toward explaining past price appreciation, and not the future. What about the future of quantitative easing and electronic money creation?
One of the reasons that Jeff Gundlach expresses a belief that 2018 will ultimately be a negative year for stock assets is because of the monetary tightening coming down the pike. An estimated $420 billion in Federal Reserve balance sheet reduction coupled with $520 billion in less European Central Bank (ECB) electronic credit creation is being overlooked by the investment community. In fact, Gundlach notes that the central bank tailwind will become a central bank headwind by the second half of 2018, as net purchasing will turn negative.

Granted, I have presented a macro-bearish front for a number of years. I anticipated the “wealth effect” via asset price reflation between 2009 and 2014, profiting accordingly. Yet I did not anticipate the extent to which foreign central banks would join the party in January of 2016, creating trillions more in dollar credits between 2016 and 2017. (There’s a “mea culpa” for the momentum players.)
That said, our stock allocation of 50% (now 60% due to price appreciation) has not deviated far from the normal target for our near-retiree and retiree client base. Most typically have between 50%-70% in bull market uptrends.
What is far more critical for my clients – far more critical than capturing every bit of euphoric momentum – is protecting against severe losses. Unless one has a plan for reducing risk when asset prices get frothy – unless one systematically lowers his/her exposure to the risk of extreme price depreciation – he/she is likely to lose too much capital when things fall apart.
I do not and have not advocated selling every asset or shorting stocks. Instead, I have put forward the plan that I intend to use to limit losses in the next bear. And I do not mind repeating myself with the chart below… it is that powerful.
When the monthly close on the 10-month SMA falls below its trendline, I will shift to a capital preservation mode that has a much lower allocation to equities. This is the approach that I employed to successfully sidestep the bulk of stock losses in the bears of 2000-2002 and 2008-2009.

Disclosure Statement: ETF Expert is a web log (“blog”) that makes the world of ETFs easier to understand. Gary Gordon, MS, CFP is the president of Pacific Park Financial, Inc., a Registered Investment Adviser with the SEC. Gary Gordon, Pacific Park Financial, Inc., and/or its clients may hold positions in the ETFs, mutual funds, and/or any investment asset mentioned above. The commentary does not constitute individualized investment advice. The opinions offered herein are not personalized recommendations to buy, sell or hold securities. At times, issuers of exchange-traded products compensate Pacific Park Financial, Inc. or its subsidiaries for advertising at the ETF Expert website. ETF Expert content is created independently of any advertising relationship.