This past week we had a look at the overall Global Macro Update, where we observed that US equities have been outperforming other major asset classes such as bonds, gold (plus commodities) and emerging markets for a while now. Today, we will focus on some underlaying changes to this, where there seems to be a change in progress. Maybe… just maybe… US equities are not going to be the best performer this year!
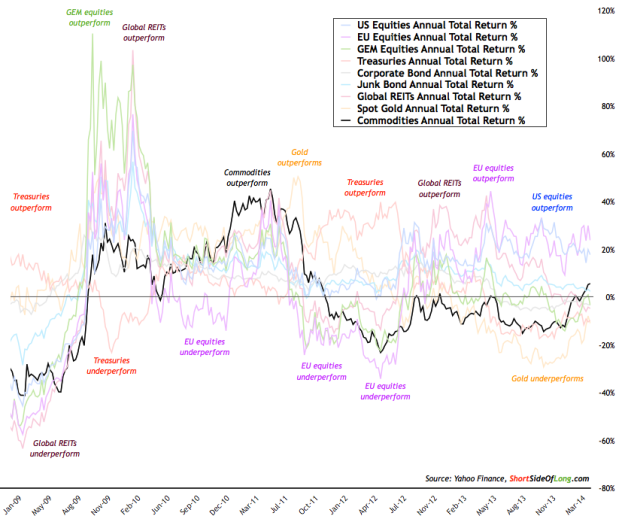
Chart 1: Annualised performance of major assets around the world…
If you have been a regular follower of this blog, I am sure you’ve seen the chart above before. It basically shows a rolling annualised performance of various major asset class around the world. These include US / EU / EM equities, Treasuries / Invest Grade / Junk Grade bonds, global REITs, gold and the commodity index. We can see from the chart above that US and EU (developed markets) equities have been the best performers over the last few quarters.
What I’ve done is highlighted the Commodity Index annualised performance, so it is easier to observe. As we can clearly see, the 12 month rolling return has now turned positive for the first time since 2011. In general, we all know that commodities have been one of the worst performers in 2012 (only beaten by awful performance of EU equities) and in 2013 (only beaten by awful performance of Gold). This asset class has been very much disowned and disliked, but now there seems to be a change occurring.
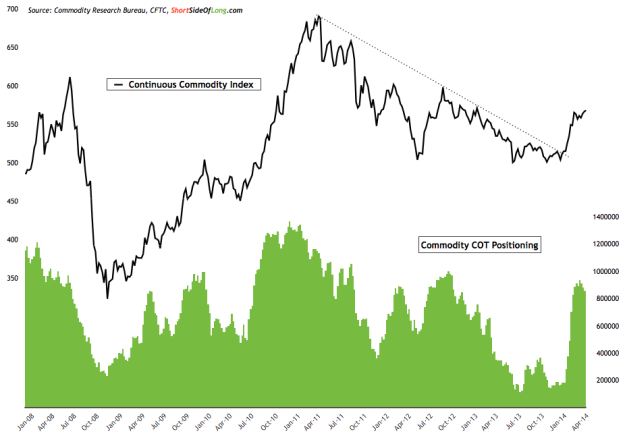
Chart 2: Commodity index broke out of its long downtrend in early 2014!

As the commodity index started to break out of its downtrend in late 2013 and early 2014, the initial gains were lead by agricultural commodities. These included Corn, Soybeans, Wheat, Coffee, Sugar, Orange Juice, Cotton and Cocoa.
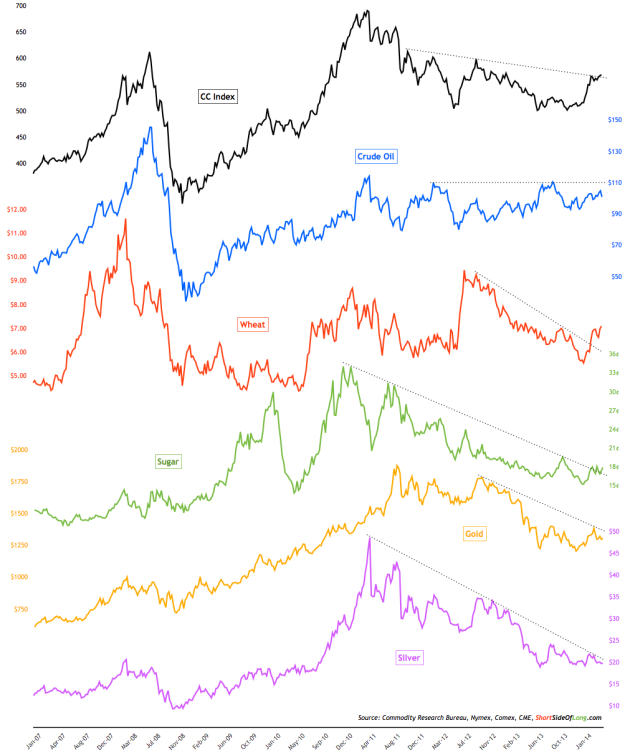
Chart 3: Some commodities continue to struggle despite a recent rally

At the same time Energy and Metal commodities, like Crude Oil and Natural Gas, or Copper and Gold have been rather mixed. Some of these commodities still remain weak even today (look at Silver) as we can see in the chart above. These commodities might need more time to bottom out and reverse their ongoing bear markets.
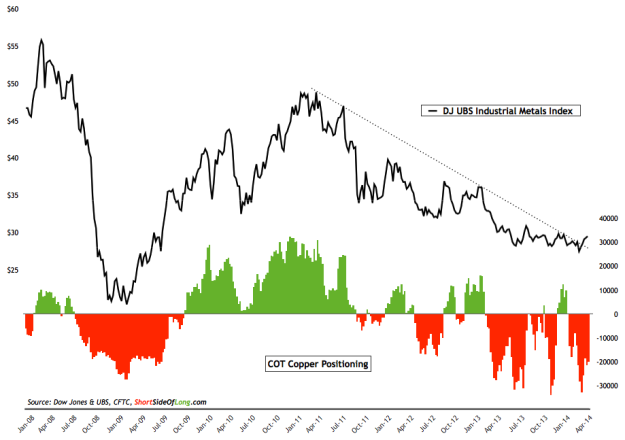
Chart 4: Industrial metals are breaking out after a three year bear market!
However, there is now an interesting change occurring in the industrial metals space—one of the most hated and disowned asset classes in the world. Despite all the negativity surrounding this asset class and the future of the Chinese economy, the base metals index seen above is finally breaking out of its three year downtrend.
Copper is recovering the majority of losses from its recent panic sell off, Nickel has been a great performer since the beginning of the year, Tin has been rallying since middle of 2013 and finally… Aluminum is trying to break above its 200 MA for the first time in 12 months.
It seems that overwhelming short positioning by hedge funds and other speculators (refer to Chart 4) occurred just near a major low and could be a contrary signal to buy this sub sector as it technically starts its break out. I will be following to see how the overall picture develops in coming weeks.


