Finally—a selloff! It’s the perfect time for us to add secure monthly dividend stocks to our portfolio now that their valuations have landed back here on Planet Earth. I’m talking about every-30-day payers with dividends that annualize up to 7.1%.
Their price decline has increased their dividend yields, giving us a shot at a terrific combo: higher yields, monthly payouts and price upside. Yes, you read that right. We don’t have to “settle” for 7.1% yields that are paid to us monthly. By buying right, we can capture some price gains, to boot.
Monthly Dividend Stocks Make Sense For Retirees And Aspiring Retirees
If you’re relying on your portfolio for income, monthly dividends are a godsend, because managing your cash flow from stocks paying quarterly is a total headache.
Let’s say, for example, that today you invested $100,000 in five S&P 500 stocks known for either high yields or dividend growth: AT&T (NYSE:T), Newell Brands NWL, McDonald’s (NYSE:MCD), 3M Company (NYSE:MMM) and Clorox (NYSE:CLX):
Here’s what your income stream would look like month to month:
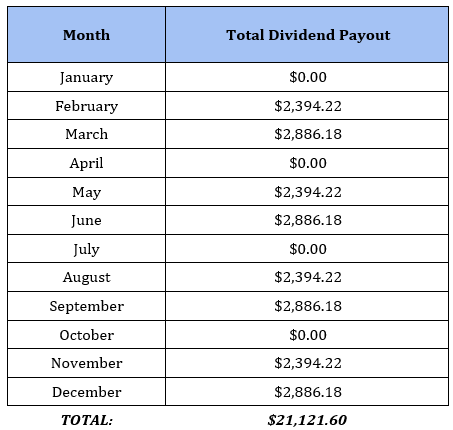
That’s all over the place! And even though you’re investing across five stocks here, you’re still going four months with zero dividend income. (Never mind the fact that you’re getting a meager $21,000 a year in dividends for your trouble.)
Monthly dividend stocks offer an opportunity to even that out. Here’s what the same $500K would look like spread over the three stocks and funds we’ll dive into below (average yield: 7.1%):
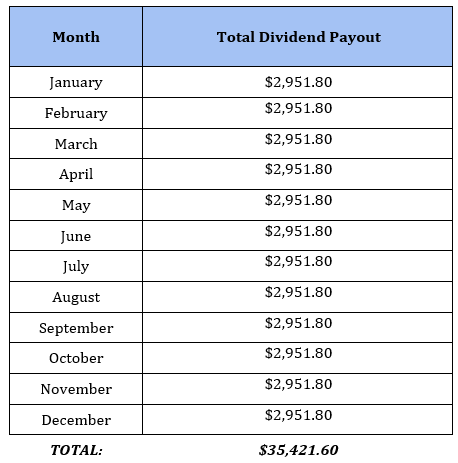
As you can see, you’re not only getting a smooth-as-glass income stream, you’re getting a lot more in dividend cash, too! Let’s dive into this trio now:
Monthly Dividend Payer No. 1: STAG Industrial
STAG Industrial (NYSE:STAG) is a real estate investment trust (REIT) that owns 457 warehouses across the US. It has four strengths we want in a rattled market like this one:
- An attractive yield, at 4.9%—nearly triple the S&P 500 average.
- Industry diversification, with its warehouses serving more than 45 sectors and no single tenant accounting for more than 3% of annualized base rent.
- An e-commerce trigger, with 43% of its portfolio tied to online selling.
- Monthly dividends (of course)!
Let’s pick up on that e-commerce hook, because it’s critical to understanding the upside here. As you can see below, online-retail king Amazon (NASDAQ:AMZN) is STAG’s top tenant. But other firms, like courier XPO Logistics (NYSE:XPO) and packaging makers DS Smith (LON:SMDS) and Packaging Corp. of America (NYSE:PKG), also benefit from surging e-commerce.
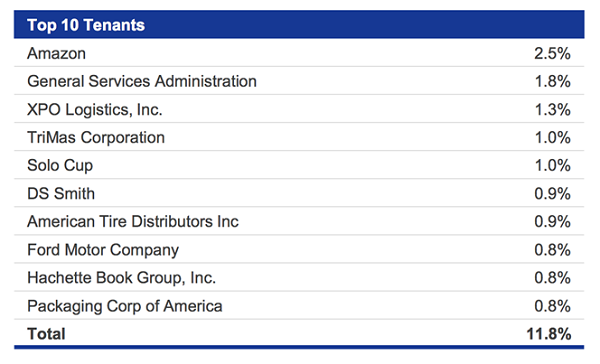
Then there’s the second-biggest tenant, General Services Administration, which handles procurement for the government and the military. You and I both know that Uncle Sam will always make the rent, even if the economy shuts down again.
Meantime, management does a great job of attracting—and keeping—tenants: STAG boasted a 97% occupancy rate in the coronavirus-hit second quarter. It also had tenants occupying 2.3 million square feet come up for renewal in that time. They all stayed on.
The pullback has cut STAG’s valuation to a reasonable 16-times funds from operations (FFO; the key profit metric for REITs). And the payout looks safe at 77% of FFO. That’s low in REIT-land, where ratios up to 90% are often sustainable.
Monthly Dividend Payer No. 2: Tekla Healthcare Opportunities Fund
Next up, the Tekla Healthcare Opportunities (NYSE:THQ), a closed-end fund (CEF) that holds large-cap pharmaceutical stocks and pays a steady monthly dividend that yields 7.8%.
The key metric to focus on with CEFs is the discount to net asset value (NAV), which shows us if a fund’s market price is below (in the case of a discount) or above (in the case of a premium) the value of its portfolio.
Right now, THQ trades at an 11.4% discount to NAV. So we’re basically getting its portfolio for 89 cents on the dollar!
The key to profiting in pharma stocks is to hone in on those with plenty of drugs in their pipelines and the strong R&D spending needed to keep those pipelines full.
This is where Tekla’s unique approach shines: its team includes medical doctors and researchers who work in tandem with investment experts to find companies in the best position to launch the next blockbuster drug.
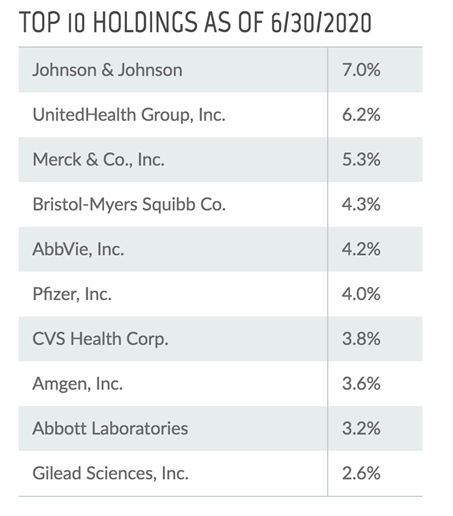
The result is a portfolio that includes companies focused on COVID-19 treatments and vaccines, like Johnson & Johnson (NYSE:JNJ), Pfizer (NYSE:PFE) and Gilead Sciences (NASDAQ:GILD). THQ’s holdings also boast strong pipelines and R&D spending.
No. 5 holding AbbVie (NYSE:ABBV), for example, spent $7.8 billion on R&D in the last 12 months, or a huge 21% of its $36 billion in sales. Its pipeline contains treatments for prevalent conditions ranging from Crohn’s disease to psoriasis and arthritis.
THQ’s management has driven its underlying portfolio (or NAV) to a 59% total return since its launch in 2014, far ahead of the 30% gain put up by the algorithm-driven iShares U.S. Pharmaceuticals ETF (NYSE:IHE). (This gain has been mostly in cash, too, thanks to THQ’s dividend.)
About that dividend: if you bought THQ’s top-10 holdings individually, your yield would average 3.2%. But with THQ, you get a 7.8% dividend and upside potential, thanks to its 11.4% discount. The better approach is obvious.
Monthly Dividend Payer No. 3: Calamos Strategic Total Return Fund
Calamos Strategic Total Return Closed Fund (NASDAQ:CSQ), payer of an 8.6% dividend, nicely complements STAG and our pharma names. Its portfolio is weighted toward US stocks, with smaller complements of corporate bonds and convertible bonds (which management can convert to stocks when it sees upside ahead).
A Diversified Fund
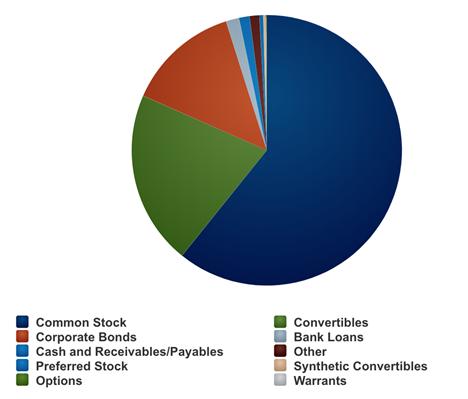
The stock portion of CSQ’s portfolio looks like a typical blue-chip mutual fund, with holdings like Apple (NASDAQ:AAPL), Microsoft (NASDAQ:MSFT) and Amazon (AMZN) topping the list. It also holds consumer stocks like Home Depot (NYSE:HD) and food maker Mondelez International (NASDAQ:MDLZ)—smart buys for the stay-at-home economy.
The fund also uses roughly 30% leverage, which does generate additional volatility but also stokes the fund’s upside. (It’s a key reason why CSQ has returned 108% in the last five years, besting the S&P 500’s 85%). Borrowing to invest is particularly smart today, with interest rates essentially at zero.
CSQ also raised its payout in February and maintained the higher rate through the crisis.
A Monthly 8.6% Dividend That Grows
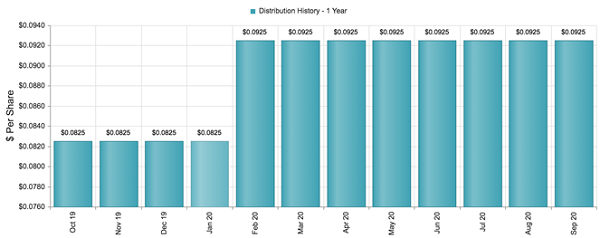
Finally, the discount, which doesn’t sound like much at 2.35%, but CSQ has traded at a 4.6% premium in the past year, so we can expect upside as its discount contracts and inevitably flips back into premium territory.
Disclosure: Brett Owens and Michael Foster are contrarian income investors who look for undervalued stocks/funds across the U.S. markets. Click here to learn how to profit from their strategies in the latest report, "7 Great Dividend Growth Stocks for a Secure Retirement."
