- English (UK)
- English (India)
- English (Canada)
- English (Australia)
- English (South Africa)
- English (Philippines)
- English (Nigeria)
- Deutsch
- Español (España)
- Español (México)
- Français
- Italiano
- Nederlands
- Polski
- Português (Portugal)
- Português (Brasil)
- Русский
- Türkçe
- العربية
- Ελληνικά
- Svenska
- Suomi
- עברית
- 日本語
- 한국어
- 简体中文
- 繁體中文
- Bahasa Indonesia
- Bahasa Melayu
- ไทย
- Tiếng Việt
- हिंदी

Dover Corporation (DOV)
Dover Corporation stock price live, this page displays NYSE DOV stock exchange data. View the DOV premarket stock price ahead of the market session or assess the after hours quote. Monitor the latest movements within the Dover Corporation real time stock price chart below.
What Is the Dover Corporation Stock Price Today?
The Dover Corporation stock price today is 212.84.
What Is the Stock Symbol for Dover Corporation?
The stock ticker symbol for Dover Corporation is DOV.
Is DOV the Same as $DOV?
$DOV is a common way to refer to the Dover Corporation ticker symbol in social media, forums, and online discussions. The dollar sign is a shorthand convention used to indicate that it is a stock ticker symbol
What Stock Exchange Does Dover Corporation Trade On?
Dover Corporation is listed and trades on the NYSE stock exchange.
Is Dover Corporation a Good Stock to Buy?
Determining whether Dover Corporation—or any stock—is a good buy requires comprehensive analysis. To evaluate its potential, users can sign up to InvestingPro, where they can assess the current Dover Corporation share price compared with the fair value and other essential metrics.
You can find more details by visiting the additional pages to view historical data, charts, latest news, analysis or visit the forum to view opinions on the DOV quote. (ISIN: US2600031080)
Currency in USD
212.60
-1.55(-0.72%)
Real-time Data·
Fair Value
An estimate of a stock's true price based on valuation models like discounted cash flow, peer valuation multiples, and dividend discount models.
Day's Range
211.89
215.82
52 wk Range
158.97
237.54
Earnings results expected in 8 days
1/2
Fair Value
An estimate of a stock's true price based on valuation models like discounted cash flow, peer valuation multiples, and dividend discount models.
Day's Range
211.89215.82
52 wk Range
158.97237.54
Key Statistics
Edit
Prev. Close
Open
Volume
Average Vol. (3m)
1-Year Change
Book Value / Share
Fair Value
Fair Value Upside
Market Cap
Shares Outstanding
Revenue
Net Income
EPS
EPS Growth Forecast
Next Earnings Date
(0.97%)
Dividends Payment Streak
P/E Ratio
Return on Assets
Return on Equity
Gross Profit Margin
Price/Book
EBITDA
EV/EBITDA
Beta
DOV Scorecard
Company’s Health
Assesses a company's financial position by analyzing its market value, financial ratios, industry benchmarks, and competitors.
UnlockFair Value
An estimate of a stock's true price based on valuation models like discounted cash flow, peer valuation multiples, and dividend discount models.
Unlock PriceTechnical Analysis
Strong Sell
Price Target
250.94
Upside
+18.04%
Members' Sentiments
Bearish
Bullish
ProTips
Tips that distill complex financial data into concise, actionable investment insights.
Has maintained dividend payments for 56 consecutive years
Technical Analysis
Summary
Strong Sell
Sell
Neutral
Buy
Strong Buy
Strong Sell
Technical Indicators
Strong Sell
Moving Averages
Strong Sell
Analyst Ratings
12 Buy
5 Hold
1 Sell
Ratings:
18 analysts
Overall Consensus
Buy
Analysts 12-Month Price Target:
Average 250.94
(+18.04% Upside)
Dover Corporation SWOT Analysis
M&A as Catalyst | Strategic acquisitions could shift Dover's portfolio toward higher-margin segments and drive valuation expansion while addressing mix effect concerns |
Analyst Outlook | Barclays maintains Equal Weight rating with a price target of $206, reflecting cautious optimism about Dover's ability to balance growth with profitability |
Growth Recovery | Explore Dover's organic top-line growth resurgence and fiscal year guidance above consensus, suggesting management confidence despite margin headwinds |
Mixed Earnings Signal | Dover's fourth quarter results revealed sales exceeding expectations while operating profit fell short, highlighting efficiency challenges amid revenue growth |
Dover Corporation Earnings Call Summary for Q1/2026
- Dover Q1 2026 EPS of $2.28 beat forecast of $2.27; revenue of $2.05B exceeded $2B estimate by 2.5%; stock surged 6.54% in pre-market trading
- Record bookings reached $2.5B, up 24% YoY with 1.2x book-to-bill ratio; all five segments reported book-to-bill above 1.0x
- Climate & Sustainability Technologies segment drove performance with 15% organic growth; free cash flow totaled $131M (6% of revenue)
- Q2 2026 EPS guidance set at $2.73; full-year 2026 EPS forecast of $10.66 supported by capacity expansion and new product launches
- Key risks include supply chain constraints, inflationary pressures, geopolitical uncertainties in aerospace/defense, and currency fluctuations
Last Updated: 04/23/2026, 10:39 AM
Read Full TranscriptDover investor slides for Q1/2026
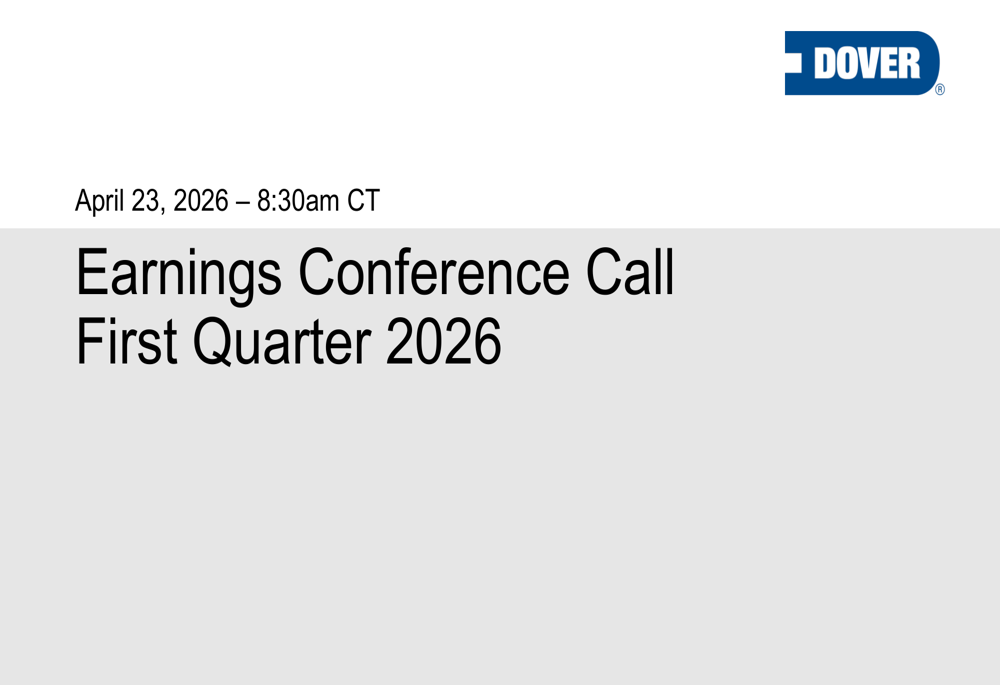
Last Update: Apr 23, 2026
See full investor slides
Earnings
Latest Release
Apr 23, 2026
EPS / Forecast
2.28 / 2.27
Revenue / Forecast
2.05B / 2B
Compare DOV to Peers and Sector
Metrics to compare | DOV | Sector Sector - Average of metrics from a broad group of related Industrials sector companies | Relationship RelationshipDOVPeersSector | |
|---|---|---|---|---|
P/E Ratio | 26.3x | 40.6x | 12.4x | |
PEG Ratio | −0.51 | 0.27 | 0.03 | |
Price / Book | 3.9x | 4.6x | 1.4x | |
Price / LTM Sales | 3.5x | 2.8x | 1.2x | |
Upside (Analyst Target) | 19.1% | 2.0% | 27.3% | |
Fair Value Upside | Unlock | −14.5% | 9.2% | Unlock |
Dover Corporation provides equipment and components, consumable supplies, aftermarket parts, software and digital solutions, and support services worldwide. The company’s Engineered Products segment provides various equipment, component, software, solution, and services that are used in vehicle aftermarket, aerospace and defense, industrial winch and hoist, and fluid dispensing end-market. This segment offers software solutions and services used in light and heavy-duty vehicle lifts, wheel service equipment, vehicle diagnostics, and vehicle collision repair solutions; winches, hoists, bearings, drives, and electric monitoring system; and radio frequency and microwave filters and switches, and signal intelligence solutions, as well as soldering and fluid dispensing solutions. Its Clean Energy & Fueling segment offers component, equipment, and software and service solution enabling safe storage and transport of fuel, cryogenic gases, and hazardous fluids, as well as operation of retail fueling and vehicle wash establishment. The company’s Imaging & Identification segment provides precision marking and coding, product traceability equipment, brand protection, and digital textile printing equipment and solution, as well as consumable, software, and service to packaged and consumer goods, pharmaceutical, industrial manufacturing, textile, and other end-market. Its Pumps & Process Solutions segment manufactures specialty pump, connector, flow meter, fluid connecting solution, plastics and polymer processing equipment, and engineered components for rotating and reciprocating machines. The company’s Climate & Sustainability Technologies segment manufactures refrigeration system, refrigeration display case, commercial glass refrigerator and freezer door, and brazed plate heat exchanger for industrial heating and cooling, and residential climate control applications. Dover Corporation was incorporated in 1947 and is headquartered in Downers Grove, Illinois.
Ownership
Ownership Overview
Top Holders
People Also Watch
FAQ
What Is the Dover (DOV) Stock Price Today?
The Dover stock price today is 212.60 USD.
What Stock Exchange Does Dover Trade On?
Dover is listed and trades on the New York Stock Exchange.
What Is the Stock Symbol for Dover?
The stock symbol for Dover is "DOV."
Does Dover Pay Dividends? What’s The Current Dividend Yield?
The Dover dividend yield is 0.97%.
What Is the Dover Market Cap?
As of today, Dover market cap is 28.71B USD.
What Is Dover's Earnings Per Share (TTM)?
The Dover EPS (TTM) is 8.00.
When Is the Next Dover Earnings Date?
Dover will release its next earnings report on Jul 23, 2026.
From a Technical Analysis Perspective, Is DOV a Buy or Sell?
Based on moving averages and other technical indicators, the daily buy/sell signal is Strong Sell.
How Many Times Has Dover Stock Split?
Dover has split 7 times.
How Many Employees Does Dover Have?
Dover has 24000 employees.
What is the current trading status of Dover (DOV)?
As of Jul 15, 2026, Dover (DOV) is trading at a price of 212.60 USD, with a previous close of 214.15 USD. The stock has fluctuated within a day range of 211.89 USD to 215.82 USD, while its 52-week range spans from 158.97 USD to 237.54 USD.
What Is Dover (DOV) Price Target According to Analysts?
The average 12-month price target for Dover is 250.94 USD, with a high estimate of 279 USD and a low estimate of 168 USD. 12 analysts recommend buying the stock, while 1 suggest selling, leading to an overall rating of Buy. The stock has an +18.04% Upside potential.
Industry Spotlight
Risk Disclosure: Trading in financial instruments and/or cryptocurrencies involves high risks including the risk of losing some, or all, of your investment amount, and may not be suitable for all investors. Prices of cryptocurrencies are extremely volatile and may be affected by external factors such as financial, regulatory or political events. Trading on margin increases the financial risks.
Before deciding to trade in financial instrument or cryptocurrencies you should be fully informed of the risks and costs associated with trading the financial markets, carefully consider your investment objectives, level of experience, and risk appetite, and seek professional advice where needed.
Fusion Media would like to remind you that the data contained in this website is not necessarily real-time nor accurate. The data and prices on the website are not necessarily provided by any market or exchange, but may be provided by market makers, and so prices may not be accurate and may differ from the actual price at any given market, meaning prices are indicative and not appropriate for trading purposes. Fusion Media and any provider of the data contained in this website will not accept liability for any loss or damage as a result of your trading, or your reliance on the information contained within this website.
It is prohibited to use, store, reproduce, display, modify, transmit or distribute the data contained in this website without the explicit prior written permission of Fusion Media and/or the data provider. All intellectual property rights are reserved by the providers and/or the exchange providing the data contained in this website.
Fusion Media may be compensated by the advertisers that appear on the website, based on your interaction with the advertisements or advertisers.
© 2007-2026 - Fusion Media Limited. All Rights Reserved.