- English (UK)
- English (India)
- English (Canada)
- English (Australia)
- English (South Africa)
- English (Philippines)
- English (Nigeria)
- Deutsch
- Español (España)
- Español (México)
- Français
- Italiano
- Nederlands
- Polski
- Português (Portugal)
- Português (Brasil)
- Русский
- Türkçe
- العربية
- Ελληνικά
- Svenska
- Suomi
- עברית
- 日本語
- 한국어
- 简体中文
- 繁體中文
- Bahasa Indonesia
- Bahasa Melayu
- ไทย
- Tiếng Việt
- हिंदी

American Express Company (AXP)
View the American Express Company stock price live, this page displays NYSE AXP stock exchange data. View the AXP premarket stock price ahead of the market session or assess the after hours quote. Monitor the latest movements within the American Express Company real time stock price chart below. You can find more details by visiting the additional pages to view historical data, charts, latest news, analysis or visit the forum to view opinions on the AXP quote. (ISIN: US0258161092)
What Is the Current Stock Price of American Express?
The American Express Company stock price is 319.21.
Who Founded American Express?
American Express was founded in 1850 by Henry Wells, William G. Fargo, and John Warren Butterfield as an express mail business. Interestingly, Wells and Fargo later established Wells Fargo & Company when they moved west.
Where is American Express HQ?
While this company has operations around the globe, the current AXP headquarters is located in New York City, New York (U.S.).
When Did American Express Stock Go Public?
American Express has been publicly traded since 1977, when it was listed on the New York Stock Exchange.
When Was the Last Time American Express Stock Split?
American Express's most recent stock split occurred on October 3, 2005. This was a 2-for-1 stock split.
What Stock Exchange Does American Express Trade On?
American Express Company is listed and trades on the NYSE stock exchange.
What Is the Stock Symbol for American Express?
The stock symbol for American Express Company is "AXP."
Is AXP the Same as $AXP?
$AXP is a common way to refer to the American Express Company ticker symbol in social media, forums, and online discussions. The dollar sign is a shorthand convention used to indicate that it is a stock ticker symbol.
What Is American Express's Business Model?
American Express operates on a "closed-loop" network, acting as both the card issuer and payment processor. This differs from Visa and Mastercard, which generally don't issue cards directly. Amex generates revenue through annual card fees, merchant fees (interchange), interest on loans, and various services and partnerships.
What Makes American Express Cards Different?
American Express is known for its premium positioning in the payment card industry. The company focuses on affluent consumers and offers extensive rewards, travel benefits, and concierge services. Amex typically charges higher merchant fees than competitors but provides merchants with valuable access to higher-spending customers.
What Is American Express's Relationship with Warren Buffett?
American Express is one of Warren Buffett's most famous and longest-held investments. Berkshire Hathaway first purchased shares in 1964 and has maintained a significant stake for decades. As of 2023, Berkshire Hathaway owned approximately 20% of American Express, making it the company's largest shareholder.
How Has American Express Evolved Beyond Card Services?
While payment cards remain its core business, American Express has expanded into digital payment solutions, business services, travel-related services, and financial planning offerings. The company has invested heavily in technology to compete with fintech disruptors while maintaining its premium brand positioning.
Is American Express a Good Stock to Buy?
Determining whether American Express, or any stock, is a good buy requires comprehensive analysis. To evaluate its potential, users can sign up to InvestingPro, where they can assess stock price fair value and other essential metrics.
Fair Value
An estimate of a stock's true price based on valuation models like discounted cash flow, peer valuation multiples, and dividend discount models.
Day's Range
317.46
322.90
52 wk Range
273.61
387.49
AXP is included in our AI-picked strategies. See how they work
Fair Value
An estimate of a stock's true price based on valuation models like discounted cash flow, peer valuation multiples, and dividend discount models.
Day's Range
317.46322.90
52 wk Range
273.61387.49
Key Statistics
Edit
Prev. Close
Open
Volume
Average Vol. (3m)
1-Year Change
Book Value / Share
Fair Value
Fair Value Upside
Market Cap
Shares Outstanding
Revenue
Net Income
EPS
EPS Growth Forecast
Next Earnings Date
(1.18%)
Dividends Payment Streak
P/E Ratio
Return on Assets
Return on Equity
Gross Profit Margin
Price/Book
EBITDA
EV/EBITDA
Beta
AXP Scorecard
Company’s Health
Assesses a company's financial position by analyzing its market value, financial ratios, industry benchmarks, and competitors.
UnlockFair Value
An estimate of a stock's true price based on valuation models like discounted cash flow, peer valuation multiples, and dividend discount models.
Unlock PricePrice Target
362.02
Upside
+13.41%
Members' Sentiments
Bearish
Bullish
ProTips
Tips that distill complex financial data into concise, actionable investment insights.
9 analysts have revised their earnings downwards for the upcoming period
Technical Analysis
Summary
Strong Sell
Sell
Neutral
Buy
Strong Buy
Strong Sell
Technical Indicators
Strong Sell
Moving Averages
Sell
Analyst Ratings
11 Buy
15 Hold
1 Sell
Ratings:
27 analysts
Overall Consensus
Buy
Analysts 12-Month Price Target:
Average 362.02
(+13.41% Upside)
American Express Company SWOT Analysis
Future Outlook | Analyst projections range from $249 to $310, reflecting varied views on AXP's growth potential and ability to navigate evolving market dynamics |
Financial Resilience | Uncover American Express's flexible expense management and integrated business model, potentially driving earnings outperformance despite market volatility |
Growth Challenges | Delve into AXP's ambitious revenue targets amidst economic uncertainties, analyzing its ability to sustain growth in discretionary spending sectors |
Premium Powerhouse | Explore American Express's market dominance in premium credit cards, its robust financial health, and strategic initiatives to maintain its competitive edge |
American Express Company Earnings Call Summary for Q1/2026
- American Express Q1 2026 EPS of $4.28 beat forecast of $4.00 by 7%; revenue reached $18.91B, up 11% YoY, exceeding expectations of $18.61B.
- Net card fees surged 16% and net interest income rose 12% YoY (FX-adjusted), driving revenue growth; return on equity remained strong at 35%.
- Stock declined 1.07% to $329.33 in pre-market despite earnings beat, reflecting investor caution amid broader market and geopolitical concerns.
- Company projects Q2-Q3 EPS between $4.27-$4.62, with growth driven by product innovation, commercial expansion, and international market penetration.
- CEO Squeri emphasized premium customer focus and innovation investments; CFO Campbell highlighted strong balance sheet and continued capital returns.
Last Updated: 04/23/2026, 09:40 AM
Read Full TranscriptAmerican Express investor slides for Q1/2026
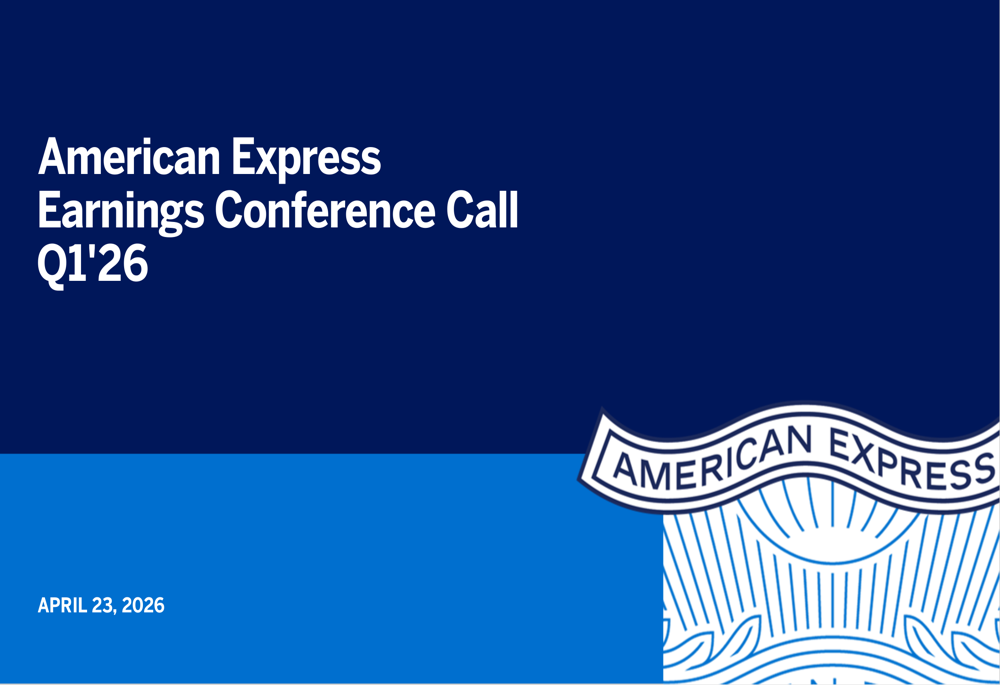
Last Update: Apr 23, 2026
See full investor slides
Earnings
Latest Release
Apr 23, 2026
EPS / Forecast
4.28 / 4.00
Revenue / Forecast
18.91B / 18.61B
Compare AXP to Peers and Sector
Metrics to compare | AXP | Sector Sector - Average of metrics from a broad group of related Financials sector companies | Relationship RelationshipAXPPeersSector | |
|---|---|---|---|---|
P/E Ratio | 19.6x | 0.0x | 9.9x | |
PEG Ratio | 1.65 | 0.00 | 0.03 | |
Price / Book | 6.4x | 0.0x | 1.0x | |
Price / LTM Sales | 3.2x | 0.0x | 2.9x | |
Upside (Analyst Target) | 10.8% | 0.0% | 16.2% | |
Fair Value Upside | Unlock | 0.0% | 1.7% | Unlock |
American Express Company, together with its subsidiaries, operates as an integrated payments company in the United States, Europe, the Middle East and Africa, the Asia Pacific, Australia, New Zealand, Latin America, Canada, the Caribbean, and internationally. It operates through four segments: U.S. Consumer Services, Commercial Services, International Card Services, and Global Merchant and Network Services. The company offers credit and charge cards and complementary products and services, including travel, dining, and lifestyle and expense management products and services; and banking and other payment and financing products and services, including deposits and non-card lending. It also provides merchant acquisition and processing, servicing and settlement, fraud prevention, and point-of-sale marketing and information products and services, as well as network services. The company offers its products and services to consumers, small businesses, mid-sized companies, and large corporations through mobile and online applications, affiliate marketing, customer referral programs, third-party service providers and business partners, in-house sales teams, direct mail, telephone, and direct response advertising. American Express Company was founded in 1850 and is headquartered in New York, New York.
Ownership
Ownership Overview
Top Holders
People Also Watch
FAQ
What Is the American Express (AXP) Stock Price Today?
The American Express stock price today is 319.21 USD.
What Stock Exchange Does American Express Trade On?
American Express is listed and trades on the New York Stock Exchange.
What Is the Stock Symbol for American Express?
The stock symbol for American Express is "AXP."
Does American Express Pay Dividends? What’s The Current Dividend Yield?
The American Express dividend yield is 1.18%.
What Is the American Express Market Cap?
As of today, American Express market cap is 217.81B USD.
What Is American Express's Earnings Per Share (TTM)?
The American Express EPS (TTM) is 16.02.
When Is the Next American Express Earnings Date?
American Express will release its next earnings report on Jul 24, 2026.
From a Technical Analysis Perspective, Is AXP a Buy or Sell?
Based on moving averages and other technical indicators, the daily buy/sell signal is Sell.
How Many Times Has American Express Stock Split?
American Express has split 5 times.
How Many Employees Does American Express Have?
American Express has 76800 employees.
What is the current trading status of American Express (AXP)?
As of May 05, 2026, American Express (AXP) is trading at a price of 319.21 USD, with a previous close of 319.68 USD. The stock has fluctuated within a day range of 317.46 USD to 322.90 USD, while its 52-week range spans from 273.61 USD to 387.49 USD.
What Is American Express (AXP) Price Target According to Analysts?
The average 12-month price target for American Express is 362.02 USD, with a high estimate of 450 USD and a low estimate of 285 USD. 11 analysts recommend buying the stock, while 1 suggest selling, leading to an overall rating of Buy. The stock has an +13.41% Upside potential.
What Is the AXP Premarket Price?
AXP's last pre-market stock price is 320.74 USD. The pre-market share volume is 365,970.00, and the stock has decreased by 1.06, or 0.33%.
What Is the AXP After Hours Price?
AXP's last after hours stock price is 322.60 USD, the stock has decreased by 3.34, or 1.05%.
Industry Spotlight
Install Our App
Risk Disclosure: Trading in financial instruments and/or cryptocurrencies involves high risks including the risk of losing some, or all, of your investment amount, and may not be suitable for all investors. Prices of cryptocurrencies are extremely volatile and may be affected by external factors such as financial, regulatory or political events. Trading on margin increases the financial risks.
Before deciding to trade in financial instrument or cryptocurrencies you should be fully informed of the risks and costs associated with trading the financial markets, carefully consider your investment objectives, level of experience, and risk appetite, and seek professional advice where needed.
Fusion Media would like to remind you that the data contained in this website is not necessarily real-time nor accurate. The data and prices on the website are not necessarily provided by any market or exchange, but may be provided by market makers, and so prices may not be accurate and may differ from the actual price at any given market, meaning prices are indicative and not appropriate for trading purposes. Fusion Media and any provider of the data contained in this website will not accept liability for any loss or damage as a result of your trading, or your reliance on the information contained within this website.
It is prohibited to use, store, reproduce, display, modify, transmit or distribute the data contained in this website without the explicit prior written permission of Fusion Media and/or the data provider. All intellectual property rights are reserved by the providers and/or the exchange providing the data contained in this website.
Fusion Media may be compensated by the advertisers that appear on the website, based on your interaction with the advertisements or advertisers.
© 2007-2026 - Fusion Media Limited. All Rights Reserved.