- Rising bond yields have increased attention on 3% as a breaking point for the U.S. stock rally
- Several factors point to a further rise in bond yields
- How much is priced in?
- Risk appetite is more telling than the chicken-or-egg cliché
As the yield on 10-year U.S. Treasuries recently spiked to its highest level in nearly four years, murmurs began among traders that the bond selloff—which drives yields higher since they move inversely to bond prices—may be a warning sign that the historic bull market in U.S. stocks could soon be coming to an end.
While the S&P 500 appears to be able to continue to move higher with no foreseeable end in sight—albeit with some consolidation over the past two days—supported by U.S. President Donald Trump’s recent victory in pushing through tax legislation and hopes that he will, eventually, follow through on his promise to embark on a $1 trillion infrastructure plan, bulls have not been swayed by concerns over a government shutdown. Nor for that matter have they even blinked at the prospect of the more perilous breakdown of trade agreements. Indeed, they've barely stuttered in their move to push stocks to new record highs with a fevered, almost religious chant of “BTFD! BTFD!” whenever equities dared to take a breather from their hefty climb.
However, the recent selloff in U.S. government debt, while yet to prove an obstacle for the apparently unstoppable rise in equities, has given pause for thought to some market participants who are observing the upward trend in the 10-year Treasury yield with more than just a little “concern”.
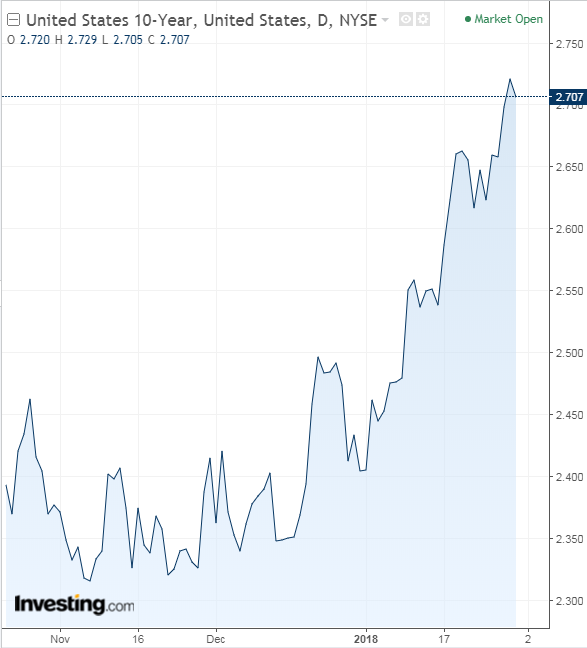
Often considered the key barometer for financial markets, the yield has spiked more than 30 basis points so far this year (see chart below), breaking above 2.7%, a level not seen since April 2014. Murmurs of warning have begun among some traders, focusing mainly on the 3% level (although over a year ago, analysts from Goldman and JP Morgan penned a now-much-closer 2.75% as the danger zone) as the percentage to watch for when the negative impact could begin on stocks and all signs seem to suggest that the yield will continue to move higher.

Factors That Could Boost Yields
On the forefront of everyone’s mind is the tapering undertaken by the Federal Reserve in order to return to policy normalization. It’s calculated that the Fed’s plan to stop reinvesting the proceeds from maturing securities on their balance sheet will result in a runoff of approximately $300 billion in 2018.
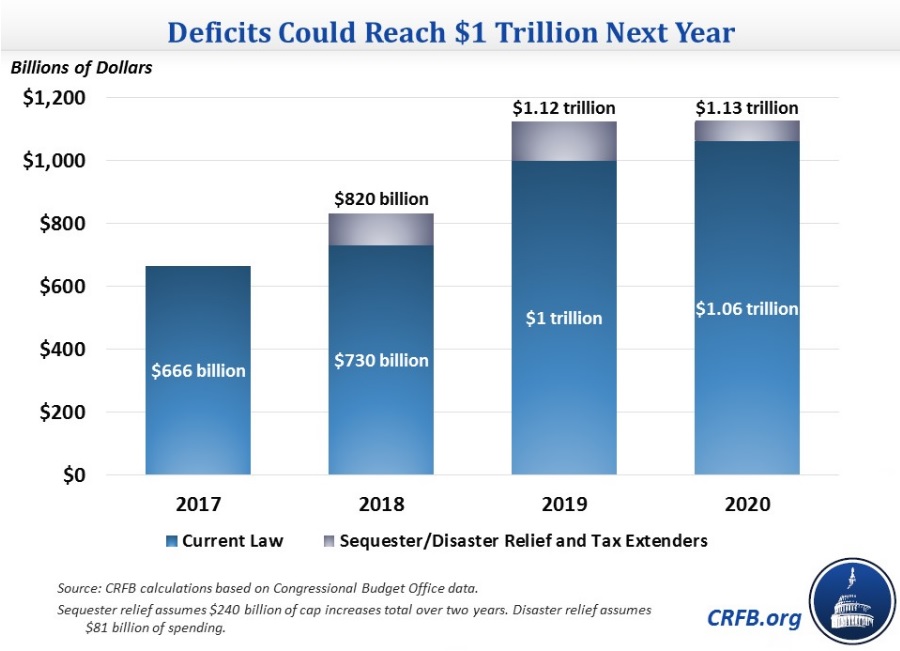
Furthermore, the recent U.S. tax overhaul is widely expected to necessitate that the Treasury issues debt in the short-term, forcing further deficit spending in order to maintain current government activities and programs. Although ultimately the legislation could create additional tax revenue, historically, bond investors would demand higher yields (by purchasing the debt at lower prices) to cover the extra risk of increased Treasury issuance as borrowing needs increase. In fact, an initial report from the Committee for a Responsible Federal Budget (a nonpartisan, non-profit organization) estimated the tax bill would contribute to pushing the U.S. deficit above $1 trillion as early as 2019 (see an even more recent evaluation in chart below).

“The final conference committee agreement of the Tax Cuts and Jobs Act (TCJA) would cost $1.46 trillion under conventional scoring and over $1 trillion on a dynamic basis over ten years, leading debt to rise to between 95 percent and 98 percent of Gross Domestic Product (GDP) by 2027 (compared to 91 percent under current law),” the CRFB analysis on the passage of the bill indicated.
Meanwhile, although recent improvements in consumer demand and business investment have supported economic growth, that increased activity is often associated with inflationary pressures from wage increases and higher costs, which in turn tends to diminish value for fixed income assets, pushing yields higher.
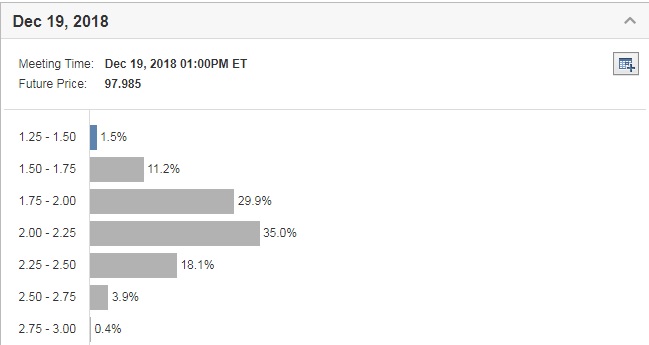
Additionally, an acceleration of inflationary pressures may also compel the Federal Reserve to speed up its policy tightening. So far, inflation has remained below the Fed’s 2% target with the consumer price index (CPI), excluding food and energy costs, showing core inflation at 1.8% in December, while the Fed’s preferred inflation metric, the core personal consumption expenditures (PCE) price index, settled at an even lower level of 1.5%. Back in December 2017, the Fed’s dot-plot showed that policymakers expected three rate hikes in 2018, while markets are in agreement, putting the odds on a third hike in December well above the 50% threshold (about 57% at the time of writing, according to Investing.com’s Fed Rate Monitor Tool).

Although incoming Fed chair Jerome Powell has yet to take over at the helm from his predecessor Janet Yellen, he is widely expected to continue with the gradual tightening that has been promised from the U.S. central bank. However, an increase in inflationary pressures runs of the risk of the Fed having to become more hawkish in its policy choices. Increasing interest rates tend to drive bond prices lower, thus increasing the yield on the debt as investors demand more return for their investment.
Caveats To Higher Bond Yields
Despite the aforementioned factors that could increase the yield on the 10-year Treasury, it’s worthwhile to consider that many have likely been priced in. As seen above, the deficit increase has already been calculated and forward-looking investors rarely wait until the actual debt in question is issued to reflect that supply increase in prices.
Similarly, the Fed’s plan for tapering has been well-transmitted.
Risk of inflation may well be the current “big unknown” and investors would do well to watch average hourly earnings in Friday’s employment report. Wage inflation has been stubbornly subdued despite the extremely low jobless rate stateside. It last tracked annual growth of just 2.5%, compared to the 4% level that is, historically, indicative of more persistent inflation and thus a more aggressive Fed.
So the pieces of the puzzle may well be in place with 10-year yields at their highest level since 2014 and market players beginning to wonder if the capital rotation out of stocks and into “safe-haven” bonds is just around the corner. The drop in debt prices could definitely present a buying opportunity for those investors willing to take profit in equities at already record highs and shift their holdings to fixed income.
Bond Yields And Stock Prices Are Not “Chicken or Egg?”
The bull-run has been strong, with the S&P 500 surpassing more than 400 days without a “healthy” 5% correction, its longest streak ever. And even as the global stock benchmark closed on Tuesday with losses for a second consecutive day, its first back-to-back drop this year, it’s a little “premature” to say that this is the beginning of the end.
As LPL Financial senior market strategist Ryan Detrick aptly tweeted prior to Tuesday’s market close: “The past two days might feel bad, but this should help.”
He noted that, since 1950, the S&P 500 has only registered monthly gains in January of more than 5% on 12 prior occasions and that the index was still up nearly 6% so far this month with just one and a half days to go. Detrick’s point was that the stock benchmark pocketed gains on all 12 of those earlier occasions.
It’s undeniable that stocks have been “long overdue” for a healthy correction to consolidate historical gains. The feeling that seems to be pervading among market participants is that the period of atypical investing tranquility could be fading.
Stocks may well be in for some volatile times, but the debate is still out on whether the uphill climb will continue this year as simply a bumpier ride or if time is running short before the road comes to an end.
Regardless, despite the recent increase in noise over the 3% level for 10-year yields, any choice of a particular level could hardly be anything but arbitrary. Of course, as always, the risk is there that “the talk” could become a self-fulfilling prophecy.
In any case, this week’s proliferation of financial media headlines claiming that “Stocks are Hit by Rising Bond Yields” are doing little more than attempting to form a cliché chicken-or-egg metaphor from their packet of pre-approved titles. No doubt among them you could also find “Bond Yields Jump on Stock Selloff” though that one hasn't been rolled out of the bag yet.
Still, the capital rotation between stocks and bonds, has been, is, and will continue to be a hand-in-hand movement. And neither is the only option on the board.
