Hawkish comments by European Central Bank (ECB) President Mario Draghi helped lift rates around the world yesterday, including Treasury yields. But it’s premature to conclude that recent flattening of the US yield curve – a bearish signal for the economy — has run its course.
For Europe, however, Draghi’s bullish outlook for the economy, accompanied by a forecast that inflation is still on track to rise, lifted yields on both sides of the Atlantic. “All the signs now point to a strengthening and broadening recovery in the euro area,” the ECB president said on Tuesday. “Deflationary forces have been replaced by reflationary ones.”
Draghi’s comments, which surprised the market, have been widely interpreted as a signal that the ECB will soon begin winding down its monetary stimulus program that’s been in force for several years. Although the pace of any tightening will likely be gradual, the shift in tone may turn out to be a watershed moment for Eurozone policy.
The news helped lift yields in the US on Tuesday, although it’s unclear if rates will continue to rise. The Federal Reserve is trying to engineer exactly that, but the monetary toolkit’s influence so far this year remains weak for longer maturities.
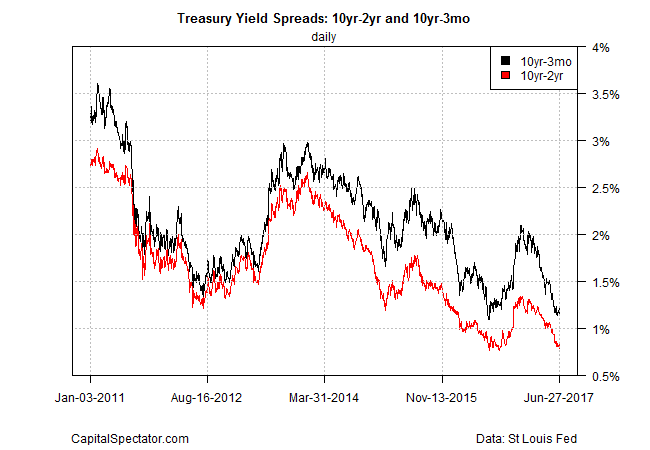
On Monday, before Draghi’s speech, the US 10-year/2-year Treasury spread fell below 80 basis points for the first time since last August, based on daily data via Treasury.gov. The spread ticked up to 83 basis points on Tuesday, but it’s not obvious that the forces that have been compressing the yield curve are no longer in play.
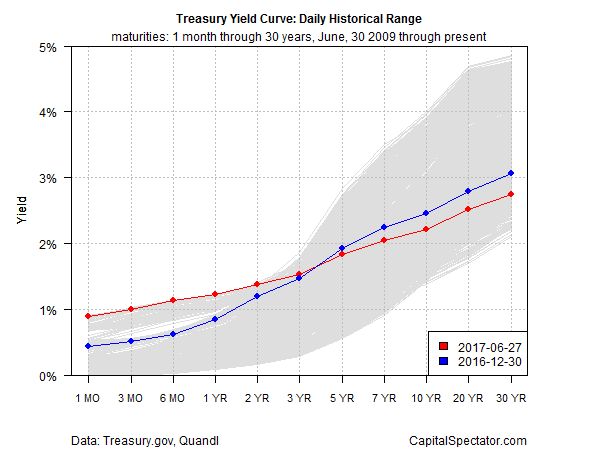
Even after yesterday’s rise in rates, the yield curve remains considerably flatter compared with last year’s close. Short rates through 3-year maturity have climbed while yields of 5-years-plus have dropped this year.
One of the factors that’s been squeezing the curve: expectations that economic growth will be softer than previously assumed. The IMF yesterday, for example, cut its forecasts for growth to 2.1% for 2017 and 2018 (from 2.3% and 2.5%, respectively). A key reason for the downsized outlook is rising uncertainty about the viability of the Trump administration’s economic policies. In other words, confidence is fading that the White House will be successful in rolling out a pro-growth legislative agenda.
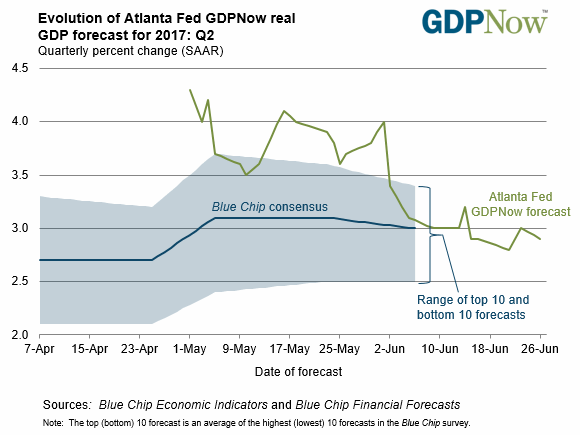
The near-term outlook remains positive, although recent estimates of US GDP growth have been sliding lately. The Atlanta Fed’s GDPNow model, for instance, is currently projecting second-quarter growth at 2.9% (as of June 26). That’s an encouraging rebound after Q1’s sluggish 1.2% rise, but only a month ago the bank’s model was forecasting a 4.0% surge in Q2.
The Treasury market seems to be pricing in a softer outlook for US economy, based on the flattening of the yield curve. Although the Fed’s official policy outlook is to continue raising rates, “the policy consensus among FOMC members seems to be eroding,” notes a report published yesterday by Roubini Global Economics.
Recent softer inflation has led some Fed policy makers to suggest delaying rate hikes if inflation doesn’t pick up. More recently, Dallas Fed President Robert Kaplan raised another argument for possible delay. He thinks low long-end borrowing rates may indicate a coming slowdown. New York Fed President Dudley disagrees. The FOMC is more likely to stick to its policy path when there is general agreement on the economic outlook. Erosion of the earlier consensus means the outlook for a fairly steady, predictable rise in rates is also eroding.
The consensus for more rate hikes will continue to erode if the 10-year/2-year spread falls below the previous low of 76 basis points from last August – slightly below the current 83-basis-point spread.
Slow-to-modest economic growth will probably prevail for the near term. The wild card is whether the Fed continues to raise interest rates without a commensurate improvement in economic growth. The case for faster output isn’t dead, but the Treasury market has turned skeptical in recent months, despite the efforts of the central bank to argue otherwise.
But hope springs eternal and so the crowd will focus on whether yesterday’s rise in yields – the benchmark 10-year Treasury rate in particular – is sustainable. One reason to wonder: the technical profile for the 10-year yield seems to be rolling over, based on a set of exponential moving averages (EMA). The 10-year rate’s 50-day EMA recently dipped below the 100-day EMA for the first time this year, signaling further weakness ahead.
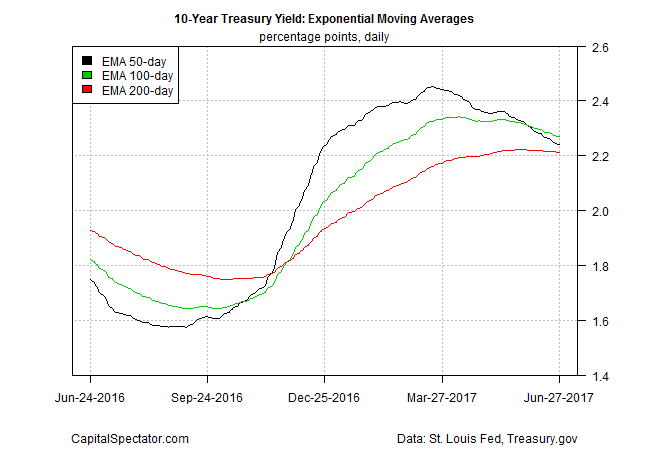
Meanwhile, the equivalent set of EMAs for the 2-year yield are pointing to higher rates, thanks to Fed policy, which is considerably more potent for the shorter end of the curve.
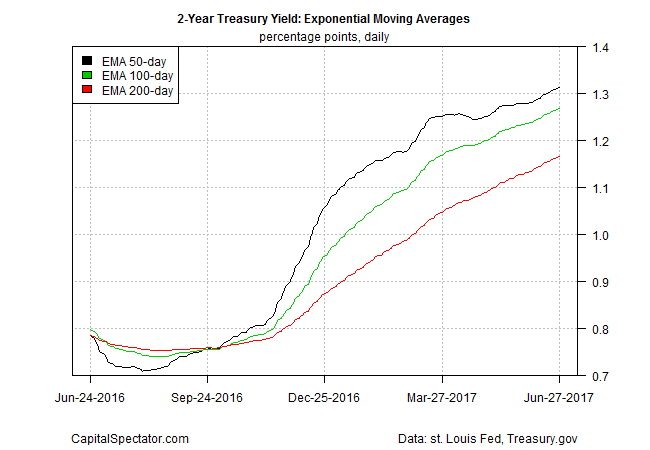
In sum, the forces of momentum appear set to flatten the yield curve further. The antidote, of course, is a run of surprisingly strong economic data. For the moment, however, the bond market is skeptical.
