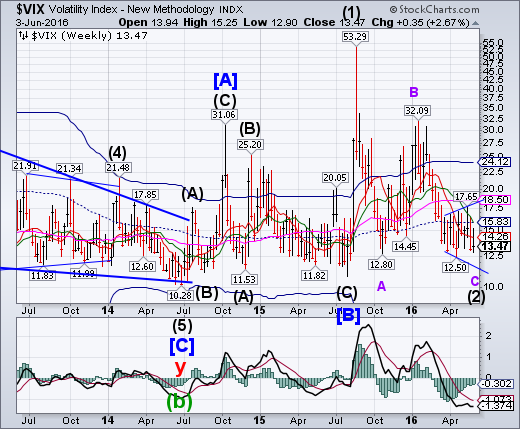
VIX appears to be in the final decline of a Broadening Bottom formation that is marked by successive higher highs and lower lows. This move may be truncated, which means it may not exceed the prior 12.50 low. In the meantime, it has given several false buy and sell signals. The Cycles Model suggests a probable low today. Broadening formations (tops and bottoms) are often known as reversal patterns.
(ZeroHedge) Who could have seen that coming?
Worst jobs print in 6 years and tumbling PMI, ISM, and Factory Orders - Did The Fed just lose it completely?
VIX was crushed once again in just utter idiocy off the lows to get S&P back to 2,100... notice a pattern there?
SPX unchanged beneath round number resistance.
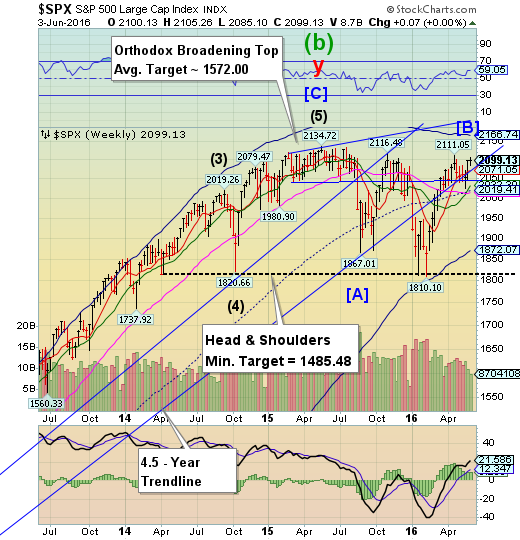
SPX is at stall speed, unable to make a new high, but not ready to decline. However, a week later it is still challenging round number resistance at 2100.00. A sideways consolidation would usually be bullish, However, a critical Pivot day may have occurred on Thursday which may have fulfilled the minimum requirement for the rally.
(WSJ) Investors reset their expectations for interest rates yet again Friday after data showed U.S. employers added the fewest jobs last month in nearly six years.
Treasury yields and the U.S. dollar dropped after the May jobs report cast doubt on the possibility of an interest-rate increase in the next few months.
Declines were less pronounced in major U.S. stock indexes. While weak economic data bodes poorly for stock-market gains, extremely low rates have bolstered stocks since the financial crisis.
NDX consolidates at a lower high.
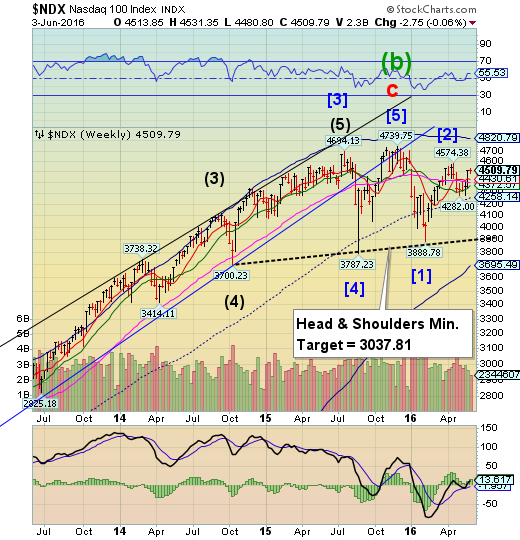
NDX consolidated this week, unable to advance higher. The NDX Pivot may have also came in on Thursday. Should the NDX turn down without making a new high, the Head and Shoulders formation may be in play once NDX declines through its mid-Cycle support at 4248.65.
(ZeroHedge) As we touched upon earlier, central banks have created an unprecedented disaster for investors and savers alike.
One critical point in what has happened since central banks have intervened in the markets and distorted prices, is that savers have been destroyed and investors are now exposed to significantly more risk. For example, in order to make a 7.5% return in 1995, research from Callan Associates Inc found that an investor could own a portfolio consisting entirely of bonds with a standard deviation of about 6%. However, to make a 7.5% return in 2015, an investor would have to shrink the allocation to bonds down to just 12%, and allocate funds into other riskier assets, increasing the portfolio's standard deviation (risk) to 17.2%. In other words, we're at the point where it takes nearly 3x the risk in order to generate the same return as twenty years ago!
High Yield Bond Index at an all-time high.
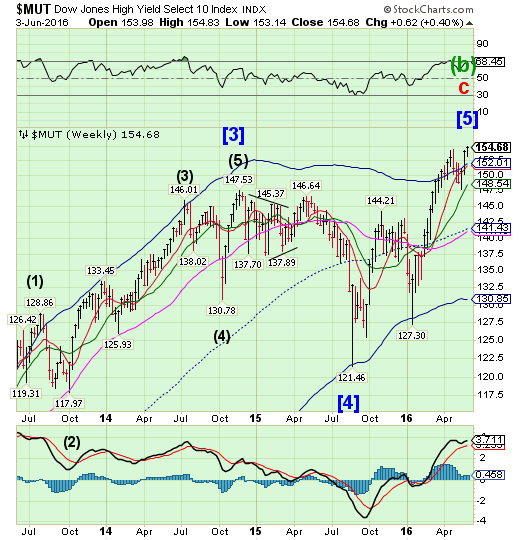
The High Yield Index exceeded its April 27 high at 154.39 by a small margin. Note that it reacts to the same pivots as equities, making its high a day later than SPX. Investors should be on the alert for a decline beneath its Cycle Top support/resistance.
(MarketRealist) High-yield bond issuance activity increased significantly last week on a strong market condition. Issuers were in a rush to close deals ahead of Memorial Day weekend. According to data from S&P Capital IQ/LCD, dollar-denominated high-yield debt amounting to $11.2 billion was issued in the week ended May 27, 2016, the largest year-to-date (or YTD). In the previous week, high-yield issuance was $8.2 billion.
The number of transactions increased to 17 last week, from nine the previous week.
Last week brought the total US dollar-denominated issuance of high-yield debt to $63.4 billion in 2016 YTD. That’s 39.0% lower than the corresponding period in 2015.
USB breaks out.
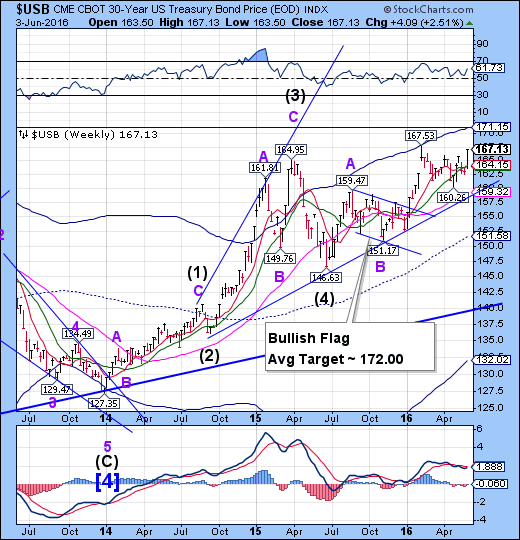
The Long Bond broke out above its previous two highs. Its minimum target appears to be its Cycle Top resistance currently at 171.15. Bonds have not been this overpriced (historically lowest yields) in over 300 years.
(Bloomberg) Bond bears were licking their wounds after a weaker-than-forecast May jobs report sent Treasuries surging. Data released later Friday suggest the pain was widespread.
Hedge funds and other speculative investors were net short Treasury two-year note futures in the week ended May 31 by the most since before the financial crisis, according to U.S. Commodity Futures Trading Commission data. Two-year notes surged Friday by the most since September after the Labor Department reported the U.S. created only 38,000 jobs in May, the lowest monthly increase in almost six years.
The euro bounced off Long-term support.
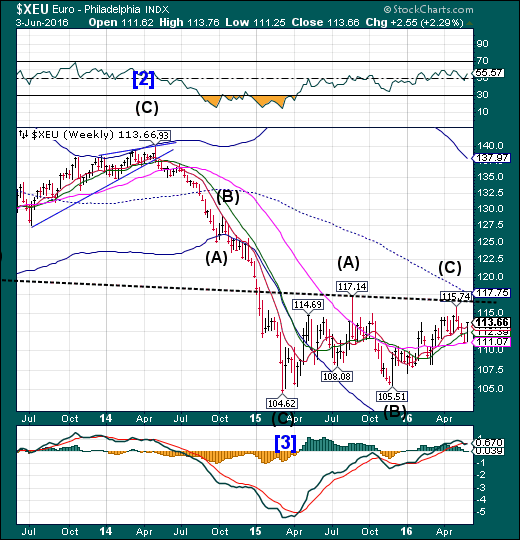
The euro bounced off Long-term support at 111.07. the Cycles Model suggests another week of rally. The trendline and mid-Cycle resistance at 117.75 may be challenged.
(ZeroHedge) Following Mario Draghi's seemingly constant mention of the ECB's credibility during yesterday's press conference, none other than ECB member (and Austrian national bank chief) Ewald Nowotny exclaimed rather oddly that "the ECB is the most independent central bank in the world." This was apparently more than former Greek Fin Min Yanis Varoufakis could handle as he unleashed a scathing op-ed to explain why, in fact, The ECB is the least independent central bank exclaiming that "the pretense of independence serves as a fig leaf for interventions that are not only politically driven, but that are also utterly inconsistent with the principles of liberal democracy."
Euro Stoxx gives back its gains.
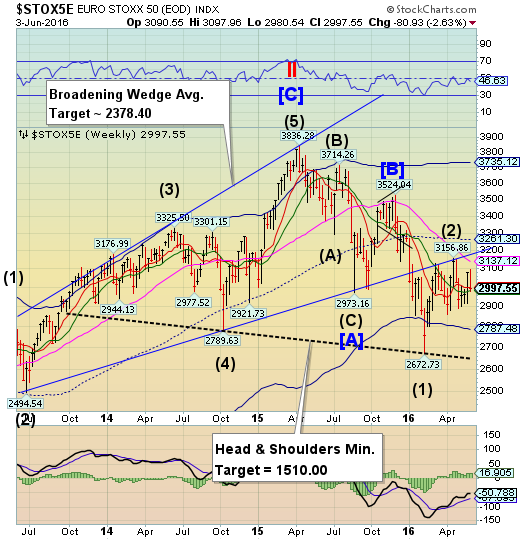
The EuroStoxx 50 Index declined beneath weekly Short-term resistance at 3002.06. A decline beneath Intermediate-term support at 2984.39 may reinstate the sell signal. A significant low may be due by mid-month.
(Bloomberg) European shares tumbled as investors considered the implications of disappointing U.S. jobs data that cast doubt on the strength of the world’s biggest economy.
The Stoxx Europe 600 Index slid 0.9 percent to 341.29 at the close of trading, posting a weekly drop of 2.4 percent, its first in four. Shares erased earlier gains after the payroll data missed forecasts. Peripheral markets in Italy, Spain and Portugal fell the most. After slipping as much as 5.4 percent from an April 20 high, European shares had recovered momentum at the end of May as better-than-forecast U.S. data fueled optimism that the economy could cope with higher interest rates. But, progress stalled this week amid resurgent worries about global growth.
The yen appears ready for a breakout.
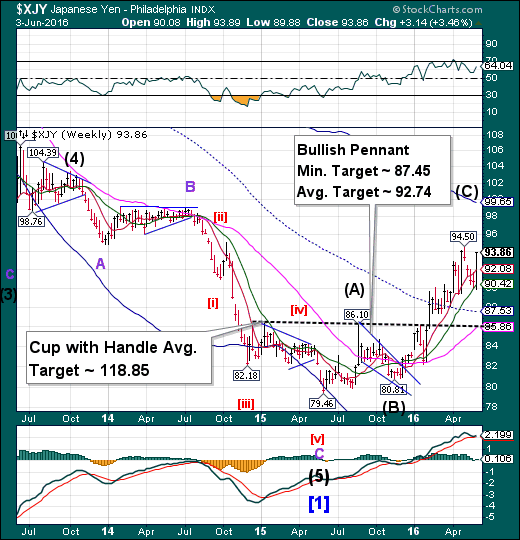
The yen bounced off Intermediate-term support at 90.42. The rally may extend for another month or longer. The inverted Cup with Handle formation appears to be activated. While the Cup-with-Handle target may seem farfetched, the Cycle Top at 99.65 may be attainable as a minimum target.
(WSJ) The dollar rose against the euro and oil-linked currencies Thursday as investors prepared for a closely watched report on the U.S. labor market report.
The WSJ Dollar Index, which measures the buck against a basket of 16 currencies, was essentially up 0.1% as the buck logged gains against the euro and some oil-dependent currencies. Meanwhile, the dollar was set to close at a three-week low against the yen after the delay of a Japanese sales-tax increase brightened the outlook for the Japanese currency.
The Nikkei gives back last week’s gains.
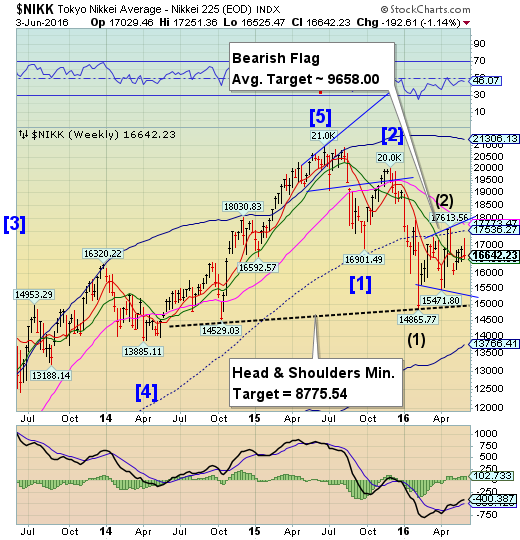
The Nikkei completed its retracement, then declined to its Intermediate-term support at 16499.03. A decline beneath Intermediate-term support may soon develop into a panic as the next support may be the Head & Shoulders neckline near 15000.00, followed by the Cycle Bottom at 13766.41.
(Reuters) Japanese stocks rose on Friday morning, supported by gains on Wall Street and a sharp jump in index-heavy Fast Retailing after the clothing retailer posted strong monthly sales.
The Nikkei advanced 0.5 percent to 16,646.55 in midmorning trade after suffering its biggest daily percentage drop in a month on Thursday. For the week, the benchmark index has shed 1.0 percent.
Trading is expected to be subdued before the outcome of the U.S. jobs report later in the day as investors continue to assess the prospects of the Federal Reserve hiking interest rates at its June 14-15 meeting.
U.S. dollar reversed from Intermediate-term resistance.
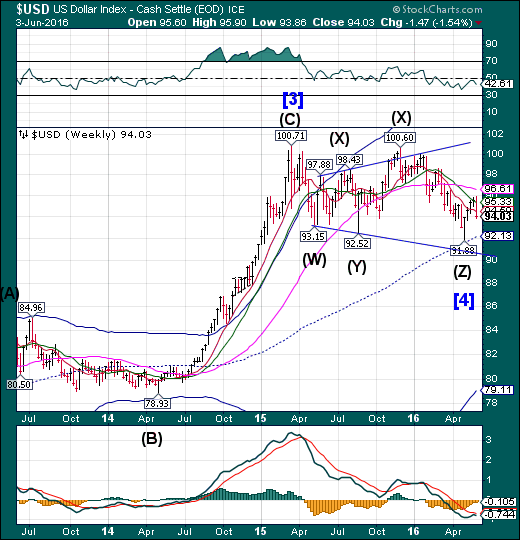
USD reversed from weekly Intermediate-term resistance at 95.33 declining beneath Short-term support at 95.60. What may follow is a decline to retest the mid-Cycle low and possibly the lower trendline. The Cycles Model suggests the next low to occur in early June.
Gold bounces at mid-Cycle support.
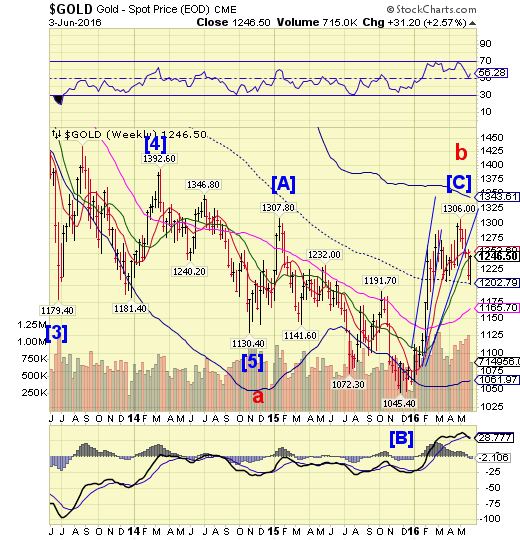
Gold bounced from mid-Cycle support at 1202.79, challenging Intermediate-term resistance at 1245.80. While the retracement amounted to 43%, it may not have fulfilled either time or distance, so we may see at least another week of positives for gold.
(MarketWatch) Gold futures rallied Friday to score a gain for the week after May employment data showed the U.S. economy created the fewest number of jobs in nearly six years.
Nonfarm payrolls rose by just 38,000 in May and hiring in the prior two months was weaker than initially estimated, the Labor Department said. The level of monthly hiring was the lowest since September 2010. Economists polled by MarketWatch had predicted an increase of 155,000 nonfarm jobs. The unemployment fell to 4.7% from 5% as 458,000 people left the workforce.
Market participants read the ugly employment data as all but eliminating the likelihood of an increase of benchmark interest rates in June or July. That’s seen as a boon for precious metals that don’t offer a yield.
Crude consolidates beneath its high.
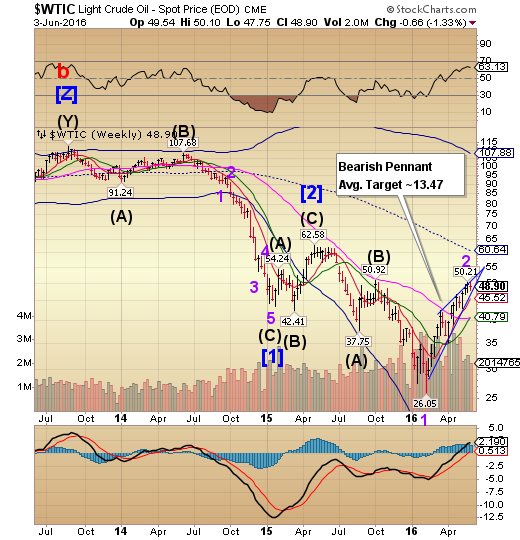
Crude continued to consolidate beneath the all-important $50.00 level. The period of strength may have expired with a potential two-week decline ahead. A decline beneath Short-term support and the Ending Diagonal trendline at 45.52 may trigger a sharp decline in crude.
(ZeroHedge) The story of the unprecedented build up of various commodity tankers off the coast of Singapore, as well as everywhere else, has been duly covered here as well as the reasons behind it.
Notably, two weeks ago we cautioned that with the contango no longer leading to profitable offshore storage of oil, many shipping companies would have to start offloading their cargo, or as we recently reported, have started incurring debt to fund said storage costs in hopes of avoiding shifting storage to land:
Shanghai Index rises to Short-term resistance.
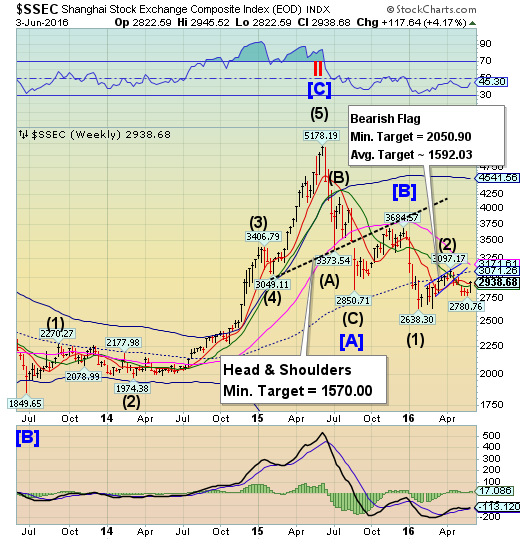
The Shanghai Index rallied above Short-term resistance at 2920.69, ending four weeks of sideways consolidation. A sideways market implies that it may continue its previous trend, once the consolidation completed. The Cycles Model suggests the probability of another week of strength before reversing back down to new lows.
(ZeroHedge) As simply put as possible... over the next 2 decades, there will be an average of 7.5 million fewer 0-55yr/old Chinese every year vs. an average annual increase of 9.5 million 55+yr/olds. And the wealthy minority of the elderly have stashed their reserves in a whole lot of expensive, vacant real estate that they intend to pass along (rent or sell) to the declining young population. What could go wrong since housing prices only go up...right!?!
The Banking Index reverses from last week’s high.
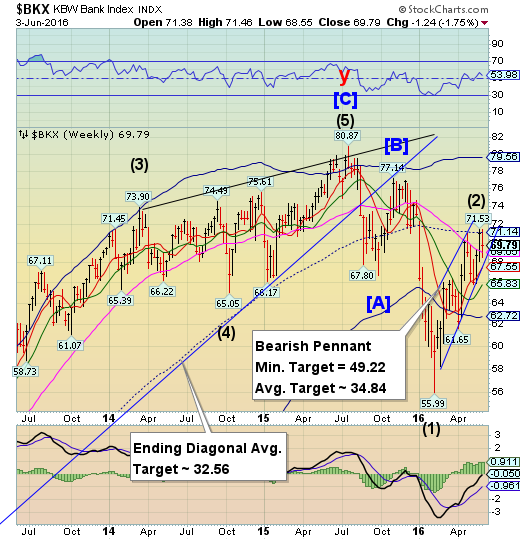
BKX reversed down this week from last week’s print high of 71.53. A break of the Pennant trendline and Long-term support at 69.05 are the keys to a resumption of the decline. Once broken, the Cycle Bottom support at 62.72 may not be capable of providing the next bounce. The next significant low may be due in mid-June.
(ZeroHedge) The world passed a historic milestone in the past week when according to Fitch negative-yielding government debt rose above $10 trillion for the first time, which as the FT adds envelops an increasingly large part of the financial markets "after being fueled by central bank stimulus and a voracious investor appetite for sovereign paper." It also means that almost a third of all global government debt now has a negative yield. The amount of sovereign debt trading with a sub-zero yield climbed 5% in May from a month earlier to $10.4 trillion, pushed higher - or lower in yield as the case may be - by rising bond prices in Italy, Japan, Germany and France.
Japan and Italy fueled the increase in negative-yielding debt in May, with three-year bonds issued by the latter sliding below the zero mark.
(ZeroHedge) For a country that prides itself (or used to at least) on the success of the entrepreneur and small business creation, a disturbing trend has developed. According to according to a new analysis by the Economic Innovation Group, fewer new businesses were created in the last five years than any other period since at least 1980.
"It's hard to put into scale the collapse of new business formation.We have no precedent for that rapid and steep of a decline. It will have a ripple effect in the economy. You're going to feel that impact five, 10, 15 years in the future" said John Lettieri, co-author of the report and co-founder of EIG.
(ZeroHedge) Yesterday JPMorgan (NYSE:JPM)'s chief executive for corporate and investment banking, Daniel Pinto, sparked hope that the collapse in investment banking revenue and profits plaguing the banking industry in the first quarter had ended, when he said that JPM is on track for a mid-teens percentage increase in markets revenue in Q2 compared with a weak period a year earlier (he also added that compensation in fixed-income is down 25% over the past five years and headcount is down 10%). This guidance however was quickly dashed by Jamie Dimon today when the CEO said during a Bernstein investor conference not to project a 15% increase in trading revenue.
(Fortune) Winter is coming for investment banks.
The once-rosy role of the trader—hustling, bustling, and raking in dough—is giving way to a new sort of financier: The technologist. Automation, software, data analysis, and algorithms are taking the workplace by storm as financial firms seek ways to cut costs and manage increasingly dismal revenue results.
(ZeroHedge) One doesn't have to be a financial guru to grasp that the problem with this "strategy" is that if a firm is going to continue to add debt to its balance sheet in order to fund buybacks (and dividends), then it needs to be able to generate enough operational cash flow in order to service the debt. Even if one makes the argument that debt is cheap right now, which may be true, or that central banks are backstopping it, which is certainly true in Europe as of the ECB's shocking March announcement in which the CSPP was revealed, the fact remains that principal balances come due eventually, and while debt can be rolled over, at some point the inability to generate cash from the operations catches up; furthermore even a small increase in rates means the rolling debt strategy is dies a painful death, as early 2016 showed.
