Weekend Update
September 4, 2015
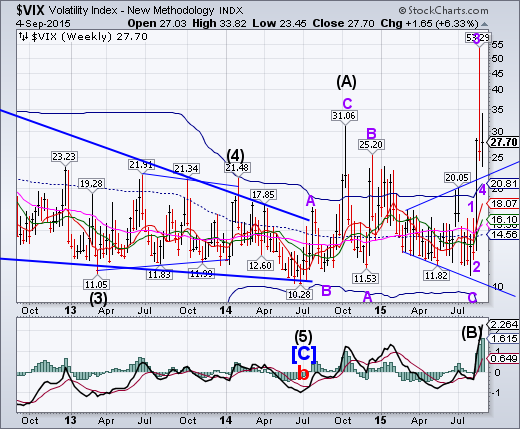
VIX has shifted gears after testing the Broadening formation high. While VIX had a lackluster week, the VIX ETFs ramped higher. An even more interesting dichotomy than last week’s.
The SPX worst closing low since October 2014.
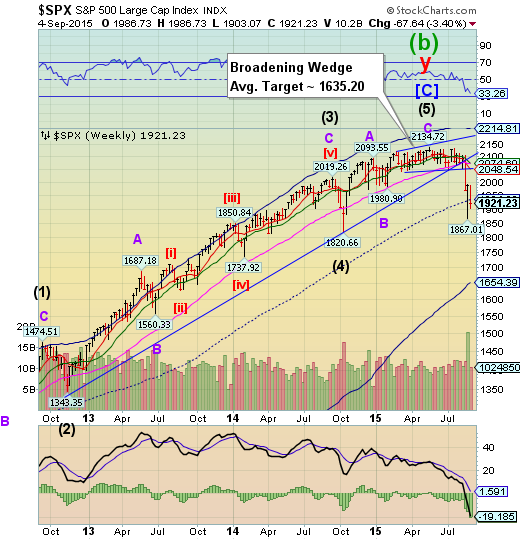
SPX took back half the gains that it made off its August 24 low, closing beneath mid-cycle support/resistance at 1934.60. The rally could not sustain itself above any support level. This leaves SPX vulnerable to a decline to its weekly Cycle Bottom at 1654.39.
(ZeroHedge) Some big moves this week...
Dow Industrials lowest weekly close since April 2014
Dow Transports lowest weekly close since May 2014
S&P 500 lowest weekly close since Oct 2014's Bullard lows
Nikkei dumped over 7% this week - worst week since April 2014
Utilities collapsed 5.1% this week - worst week since March 2009
Financials lowest weekly close since Oct 2014's Bullard lows
NDX closes beneath its August 21 low.
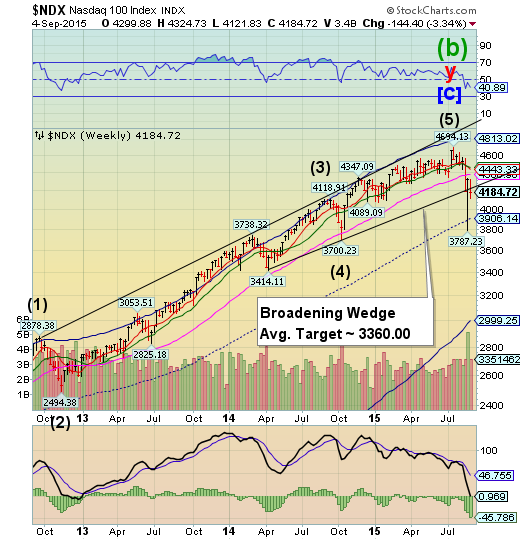
NDX closed beneath its August 21 low and the lower trendline of its Broadening Wedge, suggesting a probable repeat of the August 24 smash. The next technical supports are its mid-Cycle at 3906.14 and its Cycle Bottom at 2999.25. The Broadening Wedge formation target is also a clear probability.
(StreetTalkLive) Earlier this week, I posted a fairly in-depth look at the recent correction to try and determine whether this is simply just a correction in a bull market, or potentially something worse. To wit:
"But the underlying fundamental and economic data have been weak for some time, yet the market continued its unabated rise. The Bulls have remained firmly in charge of the markets as the reach for returns exceeded the grasp of the underlying risk. It now seems that has changed. For the first time since 2007, as we see initial markings of a potential bear market cycle."
High Yield Bonds go for the Cycle Bottom.
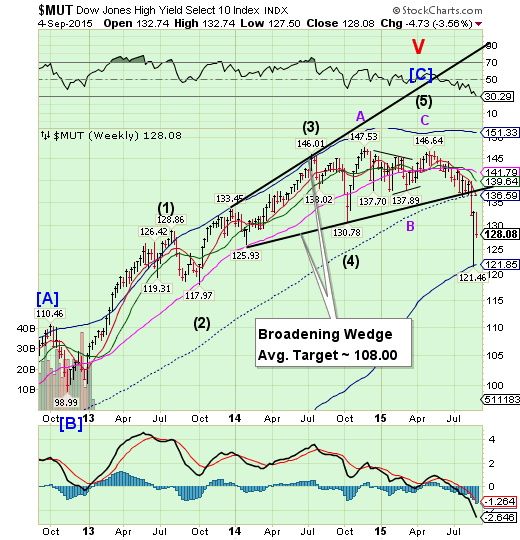
The High Yield took back half of the gains made last week off the weekly Cycle Bottom at 121.85. The NAV is back to where it was in December 2013. There is a good probability of MUT meeting its Broadening Wedge target in the next week.
(MarketRealist) There was no high yield bond issuance in the week ended August 28, 2015. High yield bonds are tracked by the SPDR Barclays (LONDON:BARC) High Yield Bond ETF (NYSE:JNK) and the iSharesiBoxx $ High Yield Corporate Bond ETF (NYSE:HYG).
Challenging market conditions have reduced the amount of high yield bond issuance in recent weeks, as you can see from the graph below. Since no deal was launched or priced last week, lets review the issuance in August.
According to data from S&P Capital IQ/LCD, dollar-denominated high yield debt amounting to $10.05 billion was issued in August. This is similar to the total issuance in July, which stood at $10.01 billion. The number of transactions in August rose to 20 from 18 in July.
The euro reversed down.
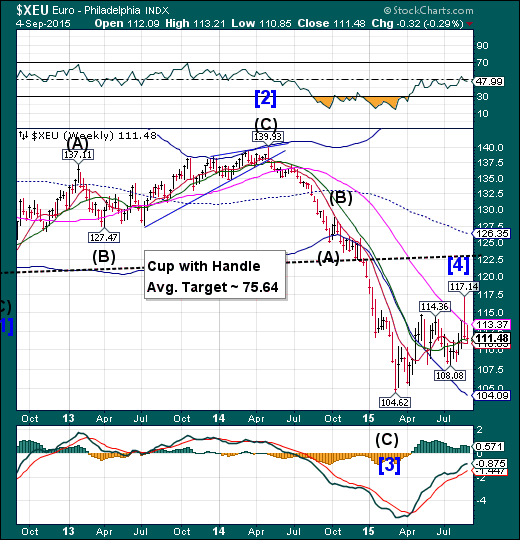
The euro reversed back down to challenge weekly Intermediate-term support at 111.29. The surge in the euro was primarily due to the demand for the local currency as European stocks were sold. In the next round of selling, liquidity may make its way to the US dollar instead.
(ZeroHedge) The most important piece of news announced today was also, as usually happens, the most underreported: it had nothing to do with US jobs, with the Fed's hiking intentions, with China, or even the ongoing "1998-style" carnage in emerging markets. Instead, it was the admission by ECB governing council member Ewald Nowotny that what we said about the ECB hitting a supply brick wall, was right. Specifically, earlier today Bloomberg quoted the Austrian central banker that the ECB asset-backed securities purchasing program "hasn’t been as successful as we’d hoped."
EuroStoxx loses its final support.
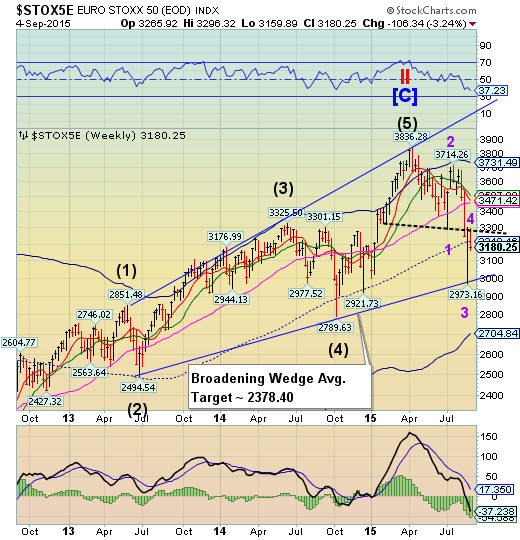
EuroStoxx 50 fell from the resistance line of its Cup with Handle formation and closed back beneath mid-Cycle support at 3218.16. The Cycles Model suggests another possible week in a panic decline that may end beneath the October 2014 low.
(Bloomberg) European stocks snapped a two-day advance, deepening a weekly loss amid mixed U.S. jobs data.
Anxieties about the strength of the global economy and an impending Federal Reserve rate increase rose to the fore again, wiping out yesterday’s optimism triggered by European Central Bank comments. While U.S. payrolls missed estimates in August, June and July figures were revised higher in Friday’s report. Unemployment also fell more than forecast, boosting the case for a rate rise. Fed officials next meet Sept. 16-17.
The yen closes above Long-term support.
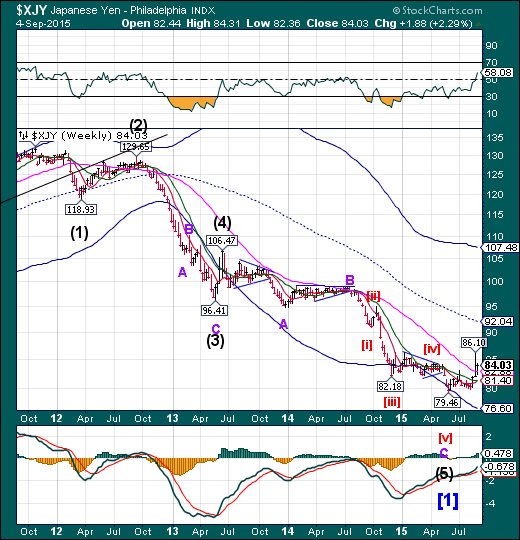
The yen closed above Long-term support at 82.88 in a bid for higher ground. It may emerge to challenge its Cycle Top at 107.48 through the balance of August and September. Another breakout above 86.10 may confirm the actionable signals, as a rally in the yen is evidence of an unwinding of the yen carry trade may be underway due to falling equities.
(Bloomberg) The yen headed for its biggest weekly advance this year while the U.S. dollar gained versus higher-yielding currencies as investors sought safety before a U.S. jobs report that may encourage the Federal Reserve to raise interest rates for the first time since 2006.
Currencies of high-yielding nations, and particularly commodity producers, weakened against the greenback amid concern Chinese shares will resume their slide when the stock market reopens next week following holidays. Australia’s dollar slid to a six-year low, on track for its worst week in more than three months. Traders are having to weigh the prospect of higher U.S. interest rates versus broader risk aversion as stocks continue to decline.
The Nikkei is rebuffed at Long-term resistance.
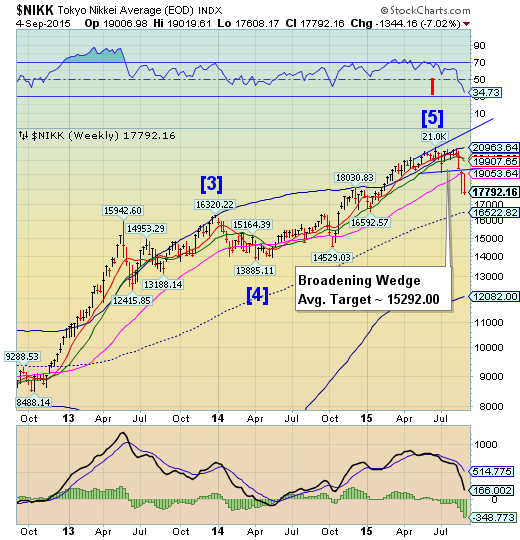
The Nikkei rallied back from last week’s sell-off, but was rebuffed at its weekly Long-term resistance at 19053.64. It has also made a new low, losing its ability to rally until the next lower support is tested. In this case, the Broadening Wedge target is below weekly mid-Cycle support, so the decline may not find support there.
(Reuters) - Japanese stocks fell in choppy trade on Friday morning, after a bounce in the yen against the euro and dollar hurt exporters and other index-heavyweights.
Investors were also wary ahead of the key U.S. jobs report later in the day as markets continued to size up data to gauge when the Federal Reserve would start raising interest rates.
On Thursday, the European Central Bank had set the tone for foreign exchange majors by affirming its readiness to provide the eurozone with another dose of stimulus.
The resulting gains in the yen seen as disadvantageous to exporters sent the Nikkei share average down 1.2 percent to 17,966.16 in mid-morning trade, after a brief 0.7 percent spike at the open.
U.S. dollar declines, then regains Model supports.
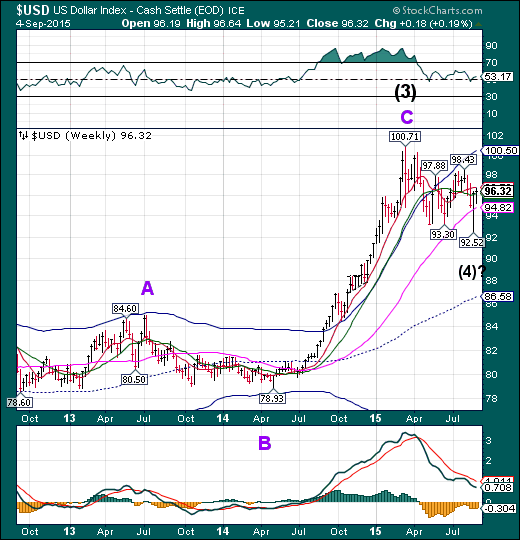
The US dollar closed above Intermediate-term support at 96.14, but may retest its lows again.The Cycle Model suggests new lows are possible through mid-September.
(Reuters) Speculators further cut back bullish bets on the U.S. dollar in the latest week to their smallest since July last year, declining for a second straight week, according to Reuters calculations and data from the Commodity Futures Trading Commission released on Friday.
The value of the dollar's net long position fell to $21.61 billion in the week ended Sept. 1, from $23.99 billion the previous week. This was the second consecutive week net dollar longs came in below $30 billion.
To be long a currency is to make a bet it will rise, while being short is a bet its value will decline.
USB turns down.
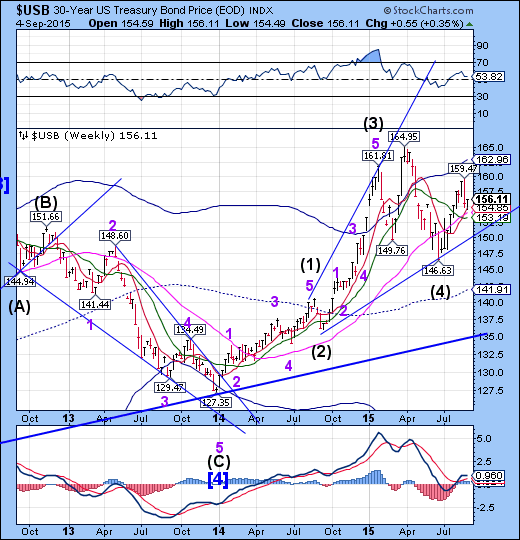
The Long Bond may have one more swing down to go, due to selling pressure from China. Selling pressure may intensify next week as the Chinese government scrambles for liquidity. This may overpower other investors seeking a haven as markets continue to turmoil over the next week.
(ZeroHedge) There has been quite a bit of market chatter this week about how central bank selling of foreign exchange (FX) reserves could cause Treasury yields to soar. The market has branded this action ‘Quantitative Tightening’; borrowing the term from a note written by a London-based markets strategist. Investors seem quick to conclude that it will result in higher yields on Treasury securities. I disagree with this simplified assumption and will use this note to explain why.
Yes, I remain bullish on long-dated Treasuries securities.
Gold tests Cycle Bottom support.
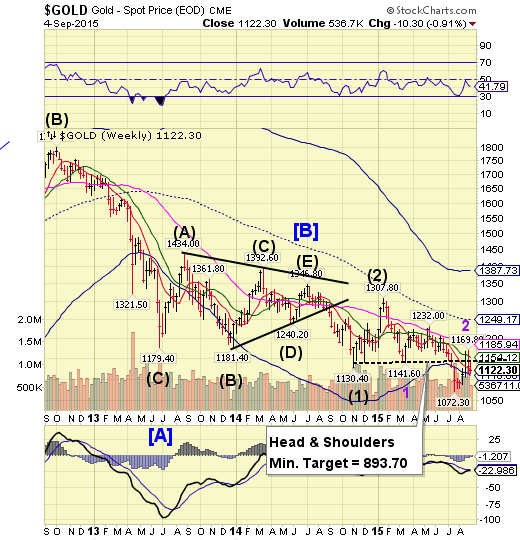
Gold declined toward Cycle Bottom support at 110.60, leaving the Head and Shoulders as a valid formation (3% rule). The downtrend may now resume for possibly another week, with greater intensity. The next immediate target for the rally may be new lows beneath 1072.30.
(ZeroHedge) First it was Germany who redeemed 120 tons of physical gold in 2014; then it was the Netherlands who "secretly" redomiciled 122 tons of gold; then this past May, we learned that Austria would be the third "core" European nation to repatriate most of its offshore gold, held primarily in the Bank of England, redepositing it in Vienna and Switzerland.
In short, beginning in 2014 and continuing through today, the gold "bleeding" from the vault located 90 feet below street level at 33 Liberty Street (and which may or may not be connected by a tunnel to the JPM gold vault located just across the street at 1 Chase Manhattan Plaza) has continued. As the chart below shows, while central banks assure the population that there is nothing to worry about when it comes to paper money, and in fact it is the evil ISIS terrorists who plot and scheme to crush the benevolent Fed with their terroristy "gold dinars" and if not that then their made in Hollywood propaganda movies, they have been quietly pulling gold from the biggest centralized depository of global gold in the world: the New York Federal Reserve.
Crude falls beneath last support.
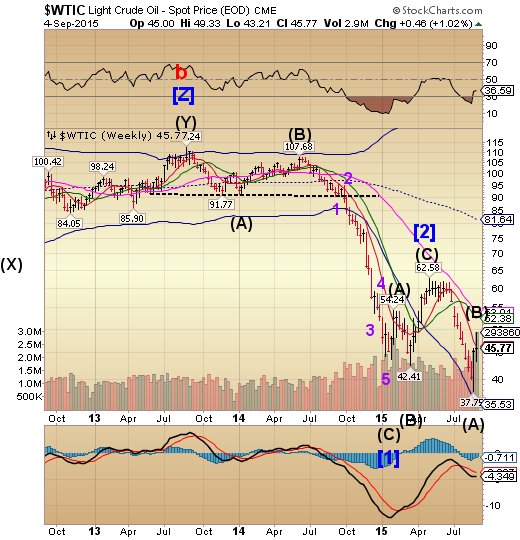
Crude appears to have completed it retracement from its Cycle low on Monday, August 24. The bounce to Short-term resistance was made on heavy volume. However, the bounce did not last and now WTIC is beneath Short-term resistance at 46.10. A much larger decline may have begun, since The Cycle Bottom offers no support.
(Reuters) Crude futures fell about 2 percent on Friday as traders shrugged off a drop in the number of U.S. rigs drilling for oil and focused instead on a supply glut and declining stock prices on Wall Street.
Trading volumes in crude were lighter than on Thursday, with players appearing hesitant to put on big positions ahead of the U.S. Labor Day holiday weekend.
"I get the feeling the longs do not want to wait out the three-day weekend," said Tariq Zahir, a trader in crude oil spreads at Tyche Capital Advisors in Laurel Hollow, New York.
Shanghai Index gets a reprieve before its holiday.
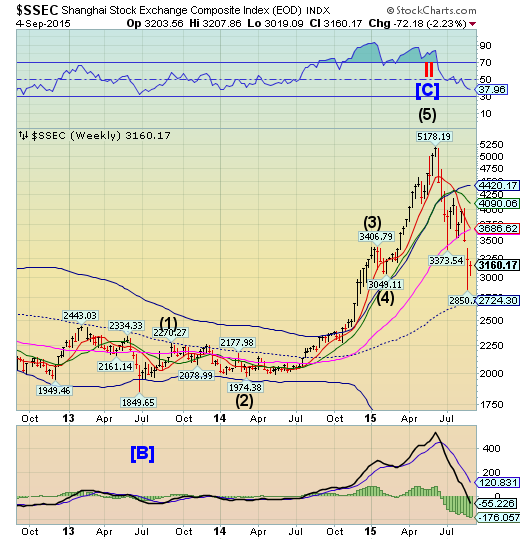
The Shanghai Index managed a partial recovery by the end of a shortened 3-day week. The market opens on Sunday evening with panic decline ready to resume. The technical landscape shows the gap at 3500.00 unfilled, leaving the index in a weakened state. This has major bond dealers worried, as noted below. A massive flow could impair all markets.
(ZeroHedge) Don’t look now, but China’s FX reserves may become the market’s most important risk-on/ risk-off trigger.
Just as the world finally woke up - with the standard two or three year lag - to what we’ve been saying about an acute lack of liquidity in bond markets on the way to making corporate bond market liquidity the talk of the financial universe, so too has everyone suddenly realized why we began shouting about the death of the petrodollar last November. The drawdown of EM FX reserves - or, as Deutsche Bank (XETRA:DBKGn) calls it, the end of the “Great Accumulation” - means a withdrawal of liquidity from global markets and the cessation of the perpetual bid for US paper that had been sustained for years by the buildup of emerging markets’ war chests.
The Banking Index fails to maintain support.
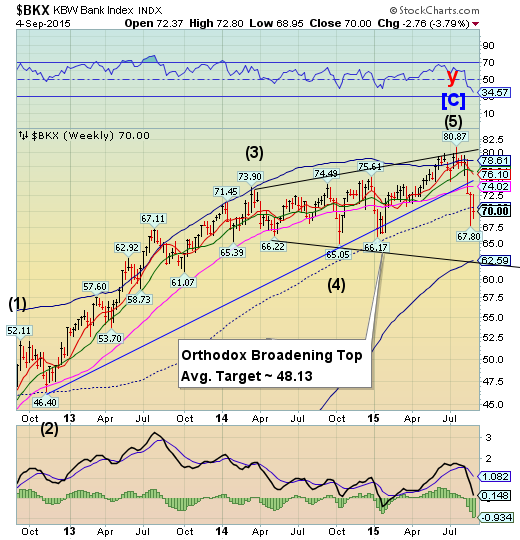
BKX gave back 42% of its prior week’s gains and closed beneath mid-Cycle support/resistance. The Cycles Model suggests that the decline may intensify very quickly next week for a possible drop to or beneath the Weekly Cycle Bottom at 62.59.
(ZeroHedge) Early last month, Bloomberg observed that plunging currencies were “handcuffing bankers from Chile to Colombia.” The problem was described as follows:
Central bankers in commodity-dependent Andes economies aren’t even considering interest-rate cuts to revive growth, even as prices for oil, copper and other raw materials collapse.
That’s because the deepening price slump is also dragging down currencies in Colombia and Chile – a swoon that’s fanning inflation and tying policy makers’ hands.
That was six days before China’s decision to devalue the yuan.
(WSJ) The past two weeks of nearly unprecedented stock-market volatility once would have marked ideal trading conditions at the country’s biggest banks. That era is over.
As Wall Street brimmed with tales of hedge-fund fortunes made and lost amid the gyrations, the big banks were largely relegated to supporting roles, according to bank executives, traders and other investment professionals.
Hamstrung by new post crisis rules governing what risks they can take, banks focused on executing trades for clients rather than making their own bets, these people said.
(ZeroHedge) For years, many - and certainly this website - had mocked both European and US stress tests as futile exercises in boosting investor and public confidence, which instead of being taken seriously, repeatedly failed to highlight failing banks such as Dexia (BRU:DEXI), Bankia (LONDON:0QDL) and all the Greek banks, in the process rendering the exercise a total farce. The implication of course, is that regulators, thus central bankers, openly lied to the public over and over just to preserve what little confidence in the system has left.
Now we know that far from merely another "conspiracy theory," this is precisely the policy intent behind the "stress tests" - as Reuters reports citing a paper co-authored by a Bundesbank economist, "banking supervisors should withhold some information when they publish stress test results to prevent both bank runs and excessive risk taking by lenders."
In other words: lie.
Disclaimer: Nothing in this email should be construed as a personal recommendation to buy, hold or sell short any security. The Practical Investor, LLC (TPI) may provide a status report of certain indexes or their proxies using a proprietary model. At no time shall a reader be justified in inferring that personal investment advice is intended. Investing carries certain risks of losses and leveraged products and futures may be especially volatile. Information provided by TPI is expressed in good faith, but is not guaranteed. A perfect market service does not exist. Long-term success in the market demands recognition that error and uncertainty are a part of any effort to assess the probable outcome of any given investment. Please consult your financial advisor to explain all risks before making any investment decision. It is not possible to invest in any index.
The use of web-linked articles is meant to be informational in nature. It is not intended as an endorsement of their content and does not necessarily reflect the opinion of Anthony M. Cherniawski or The Practical Investor, LLC.
