Micron surges after one of the biggest beats in U.S. semis history
- Despite record US jobs lost, and unprecedented unemployment rate, equities rally
- Oil sees first back-to-back weekly gain in 11 weeks
- Contradictory and potential pattern failures project market out of sync
Despite the worst monthly nonfarm payrolls release in over 70 years, and with the unemployment rate in the country tripling to the highest level on record, U.S. equities still rallied on Friday, for a second day, on optimism the worst of the COVID-19 pandemic is behind us. Oil finished its first back-to-back weekly climb since February.
Though we anticipate the bullish sentiment to carry into the coming week's trade, out-of-sync technicals could still test previous highs.
Dual Pattern Failure, Out Of Sync Patterns Are Signs Of The Times
On Friday the S&P 500 climbed, with all 11 sectors in the green. There's still plenty to be concerned about, however: though Energy roared back from the netherworld of subzero prices hit just a few weeks ago and outperformed on both a daily (+4.6%) and weekly basis (+8.2%), there's still lots of risk for commodity traders to worry about.
Industrials were Friday's runner up, coming in a distant second (+2.5%), up 1.32% over the course of the week. Technology shares gained 1.4% on Friday, up +6.6% on a weekly basis, as software and hardware demand increased amid the lockdown.
Overall, individual market segment performance was reminiscent of the recent forceful rebound in equities from their March lows.
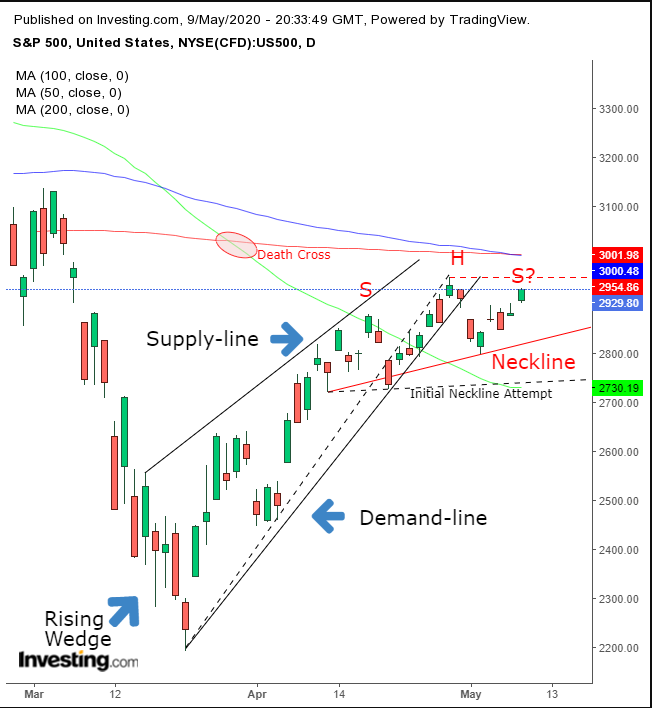
From a technical perspective, Friday’s rally is testing a possible H&S top, whose failure would also blow out a completed rising wedge. Chances for the pattern’s breakdown have increased this week, when prices made a new weekly high for the uptrend since the March low.
The dichotomy of back-to-back bearish patterns while investors add risk does not surprise us. The bullish fundamental narrative and the bearish technical picture complement each other.
The dynamics of a rising wedge embody the spurned hopes of premature exuberance. The downside breakout of this apparently bullish pattern—as both highs and lows rise in an uptrend—suggests a picture in which the faster rising demand-line gives out as buyers give up on the rally. At the same time, the slower rising supply-line squeezes demand, and price, below the pattern.
The follow-up pattern, a possible H&S top, would be a nice confirmation for the rising wedge. The dynamics of a H&S top are similar to those of the rising wedge—they both indicate buyers whose dominance forms a successive series of rising peaks and troughs, which shapes the right shoulder and the head—indicating buyers have run out of steam and are unable to form a third, higher peak, thereby keeping the uptrend going.
The fact that we had to redraw the rising edge and rework the neckline of our H&S pattern may seem counterintuitive to everything we've said till now about the bearish picture these patterns represent. Nonetheless, what we're seeing now is this: the neckline of our head & shoulders will retest, and indeed threaten, both the H&S and the rising wedge simultaneously, given that they both share the same peak.
In fact, the extremely near, very real possibility of a dual pattern failure is a sign of the times. The bearish technicals project the horrendous economic data, including the worst NFP in history, and the worst global pandemic in a century. A failure would reflect that fundamentally investors are past all that—whether that's justified or not (since markets are still being boosted by infinite QE).
One powerful driver for the broader market rally last week was the mammoth rebound in the price of oil.
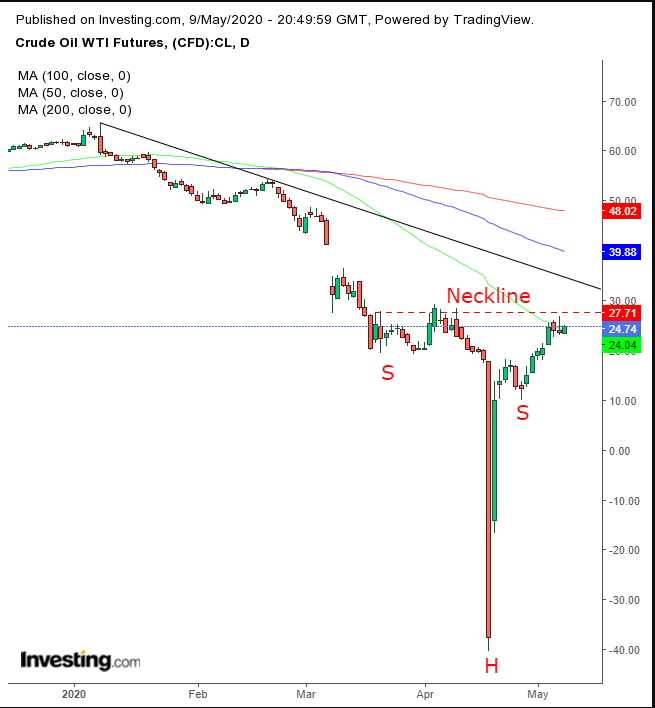
The initial declines hit in March as planes were grounded, businesses shuttered and cars were parked as lockdowns spread. The expectation of global reopenings reawakened confidence that demand for the battered commodity will spike, generating oil’s first back-to-back weekly gains since February.
Technically, oil is retesting the potential neckline of a H&S bottom, whose upside breakout would also scale above the commodity’s downtrend line since Jan. 8. Should that happen, we’d have to reconsider our previous position that oil would range between $20 and $30 dollars till the next catalyst appears.
Only the US dollar—which sometimes acts as a risk currency while at other times is considered a safe haven asset—could come back almost unscathed from the worst monthly job report in the country's history. The USD ended less than 0.1% lower after the depths of the devastation revealed in April Nonfarm Payrolls release. The global reserve currency rebounded from an earlier, 0.7% plunge.
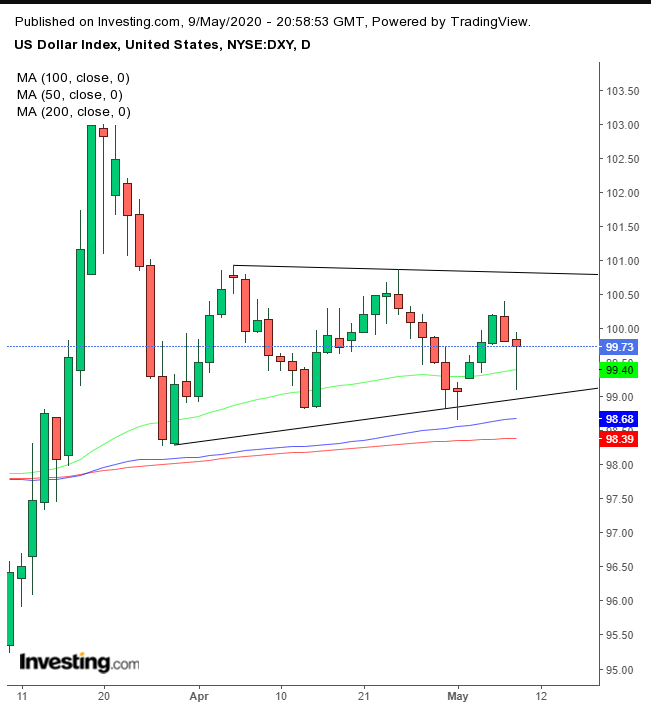
From a technical standpoint, the dollar resumed trading along an ascending triangle, which formed, counterintuitively, after a descent, yet is supported by all three major moving averages: the 50, 100 and 200.
After rising along with the dollar as another safe haven asset, gold was pressured by the equity rally when investor appetite for risk returned.
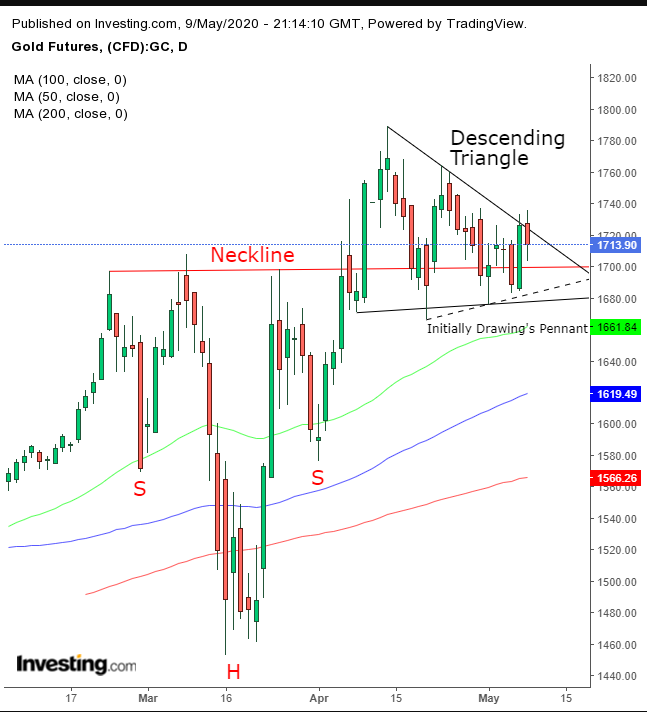
Technically, the supply-demand balance for the yellow metal is forming a descending triangle.
We're readjusted our view on gold's technicals, similar to our outlook for the SPX. After further consideration, we've redrawn the pattern to better represent the pricing structure. Much like the S&P 500, the precious metal’s pattern is following a preceding pattern. However, while the equity index’s first pattern was bearish, the negative correlation for gold has formed a bullish pattern.
And much like with the dollar’s own bullish pattern, though it should be bearish after a drop, gold’s bearish pattern is following a completed bullish formation.
This market environment has many examples of out-of-sync patterns. In the case of gold, all we can do is wait and see which pattern fails, then bet on the winner.
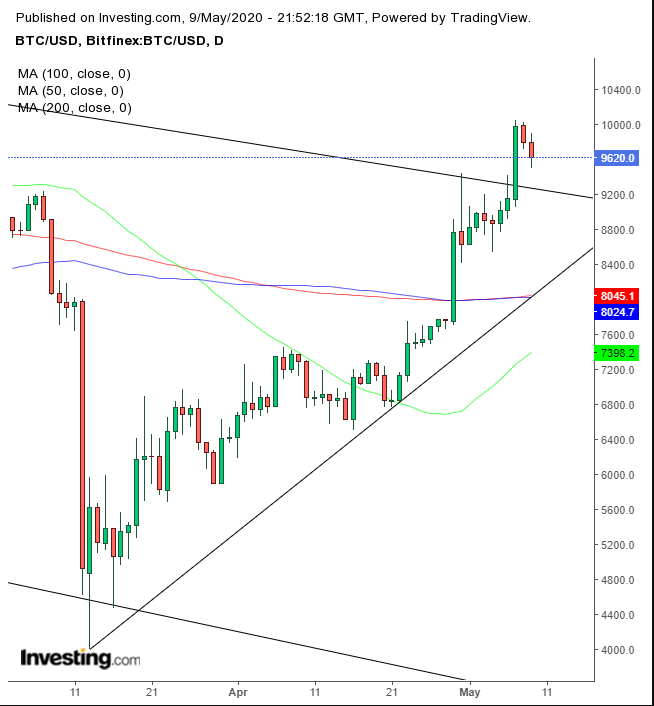
Bitcoin broke free of its falling channel, suggesting a new uptrend since the March 13 bottom. This is a new trajectory, just days ahead of Tuesday’s halving. The expected selloff after the event could test this new trend.
The Week Ahead
All times listed are EDT
Monday
21:30: China – CPI: expected to rise to -0.5% from -1.2% on a monthly basis, while retreating to 4.3% from 3.7% YoY.
Tuesday
8:30: US – Core CPI: seen to have edged down to -0.2% from -0.1%.
22:00: New Zealand – RBNZ Interest Rate Decision, Rate Statement: rates forecast to remain flat, at 0.25%.
Wednesday
2:00: UK – GDP: probably fell to -2.1% from 1.1% YoY, while plunging to -2.5% from 0.0% QoQ.
2:00: UK – Manufacturing Production: presumed to have plummeted to -5.7% from 0.5%.
8:30: US – PPI: expected to have fallen to -0.5% in April, from -0.2% previously.
10:30: US – Crude Oil Inventories: last week's reading showed an addition of 4.590M barrels to stockpiles.
Thursday
8:30: US – Initial Jobless Claims: the previous week's 3,169K new job losses brought the seven week tally to over 33 million US jobless.
22:00: China – Industrial Production: seen to jump to 1.5% from -1.1% YoY.
Friday
2:00: Germany – GDP: estimated to plunge to -2.1% from 0.0% QoQ and to -1.6% from 0.3% YoY.
8:30: US – Core Retail Sales: seen to have fallen further, to -8.6% from -4.2%.
9:15: US – Industrial Production: the contraction is anticipated to have worsened in April, to -11.5% from -5.4%.
