- All four major US indices erased intraweek losses and post small gains, but still under resistance.
- All are also potentially forming continuation patterns, suggesting another leg up, to retest record prices.
- Market narrative shifts from fear of higher rates to acceptance, but expect more fluctuations till a higher price peak is formed.
- Dollar bearish on weaker US growth compared to Europe and Japan
- Oil climbing but must post new peak to sustain uptrend
- Bitcoin, Ethereum within bearish trends
The Week That Was
On Friday all four major US indexes advanced, wiping out three days of losses and extending the weekly advance for a second week of gains. Thanks go to a declining dollar and Treasury yields, which have retreated on a shift in market narrative. Now the story says that Jerome Powell’s Federal Reserve will not raise interest rates too quickly, even as the economy picks up.
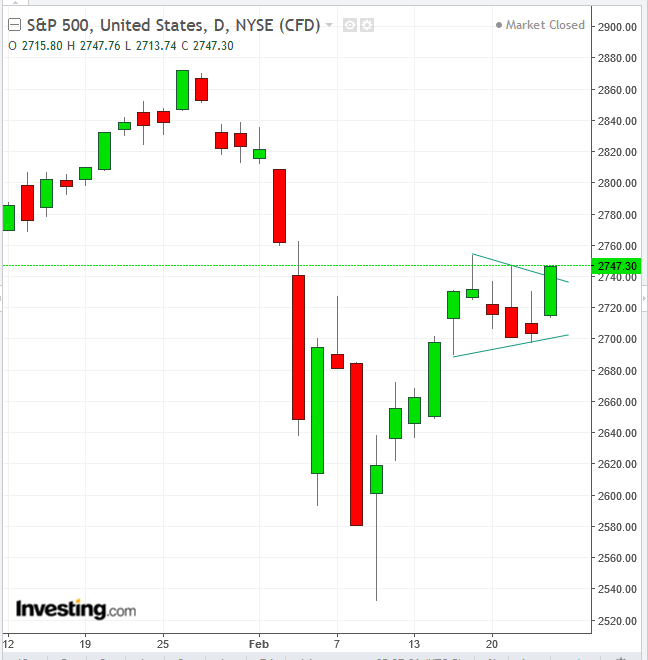
The S&P 500 climbed on Friday, gaining 1.6 percent, with every sector in the green. However, the leader was defensive Utilities, up 2.6 percent, while growth sector Industrials lagged, moving just 0.83 percent higher. The benchmark index advanced 0.55 percent for the week.
While the price is still beneath the resistance of the shooting star of the 16th, it may be forming—or even breaking—a continuing pennant pattern.
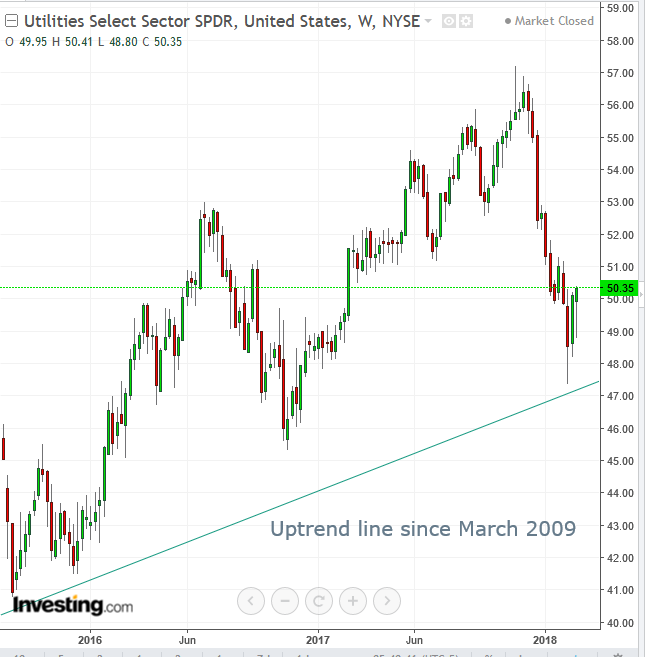
The weekly advance of the Utilities Select Sector SPDR (NYSE:XLU) confirmed the uptrend line since March 2009, rising for a third week since nearly bouncing off it.
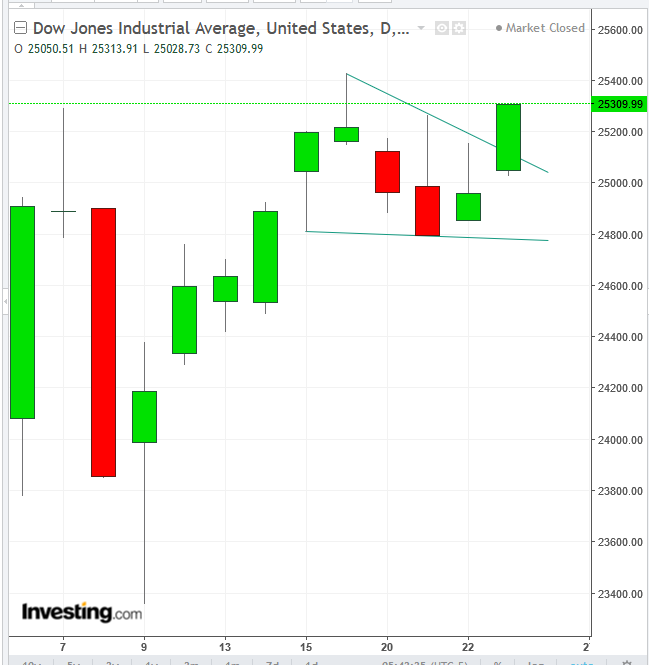
The Dow Jones Industrial Average advanced 1.4 percent on Friday, canceling the losses from Tuesday and Wednesday, but still subject to the shooting star of the 16th. Like the S&P 500, this index too may be forming or even have completed a continuing pennant pattern.
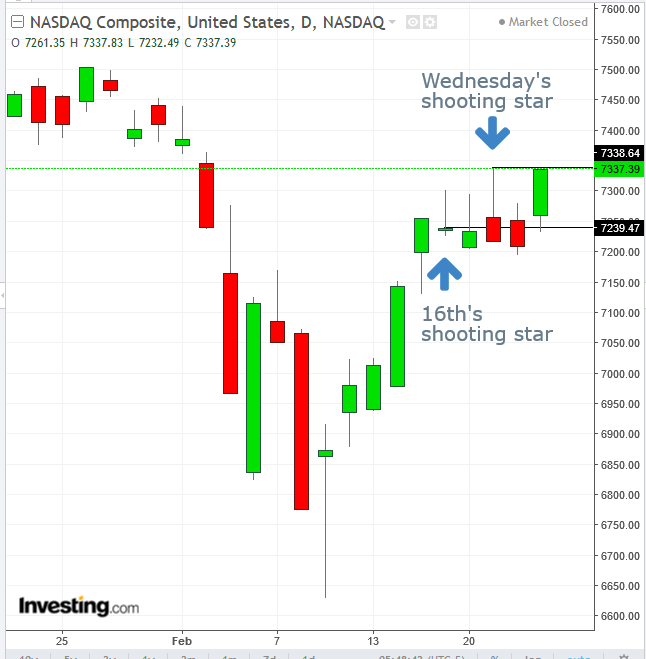
The NASDAQ Composite climbed 1.25 percent on Friday, to gain 1.35 percent for the week. On a weekly basis it outperformed its peers.
For anyone who isn’t convinced of the significance of support and resistance, a quick check of the NASDAQ Composite may demonstrate the power of the shooting star of the 16th. On no day did the index close higher than the 7,239.47 closing of the 16, that is, until Friday. However, Friday’s closing could not overcome Wednesday’s shooting star.
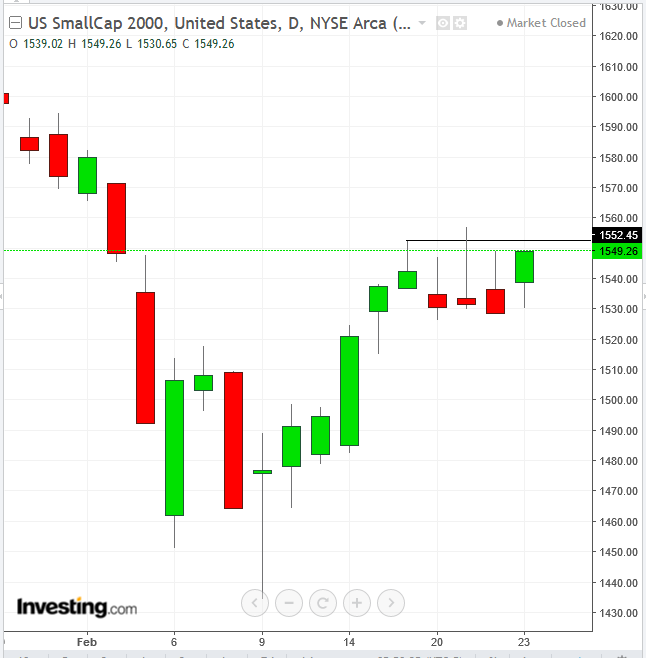
The small-cap Russell 2000 pushed higher on Friday by 1.35 percent, to gain 0.4 percent for the week. It outperformed all other major US indices on a daily basis. It too is still dominated by the shooting star of the 16th.
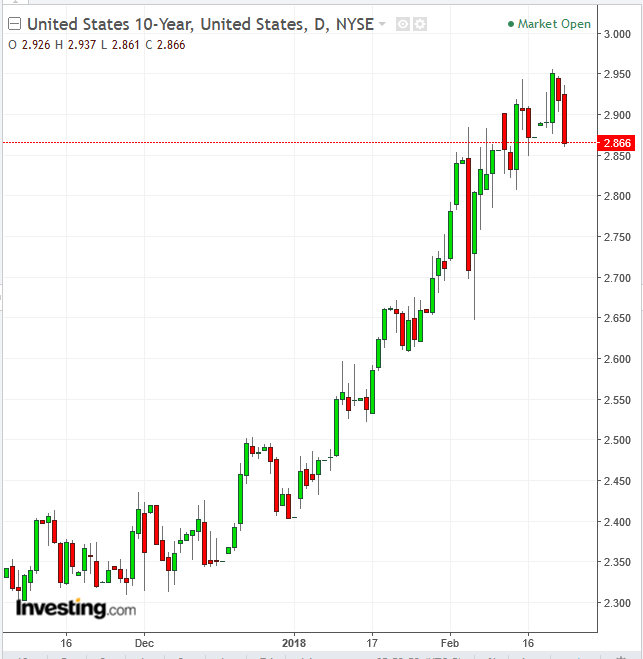
The 10-year Treasury yield slipped to 2.87 percent, roughly where it started the week, as investors dissect the Fed’s semiannual monetary policy report to Congress. The dollar was flat versus major peers.
The report indicated that the central bank sees the labor market at or beyond full employment, while some pockets of finance are showing signs of rising leverage and high valuation. Concern that the Fed would step up the pace of rate hikes rattled markets earlier in the week. Investors may note, however, that historically, markets kept climbing during the first 18 to 24 months of rising interest rates, when inflation remained under the Fed’s control.
Traders seem unconvinced by the Federal Reserve’s hawkish tilt, with the market still pricing in less than the three quarter-point rate hikes that officials have signaled as likely this year. Minutes of the Fed’s January meeting indicated confidence the economy is strengthening amid signs inflation is rising.
From a technical standpoint, for as long as markets won’t make new highs—starting with the recent resistance of the shooting-stars, appearing in all four major US indices—investors are likely to oscillate between optimism regarding strong economic/corporate fundamentals and anxiety about rising interest rates.
Perhaps the market narrative is beginning to dictate the plain fundamentals: rates should rise for the same reason equity prices have been rising, because of an expanding economy. GDP growth has averaged 2.9% over the past three quarters, compared with an average of 2.1% since 2010. This, along with a 17-year low in unemployment, rising consumer confidence, and increasing business investment is spurring higher inflation expectations, which in turn is leading to expectations for potentially faster rate hikes from the Fed. Historically, stocks do quite well in the early phases of Fed rate hikes, which is right now.
Either way investors choose to slice it, interest rates are still very low by historical standards. It’s true that 10-year yields have risen from 2.04 to 2.95 percent, a four-year high. However, in 2013, rates had a more dramatic rise of 84 percent, from 1.63 to 43 percent. How did the market react? In 2014, it advanced almost 14 percent.
While we are less likely to enjoy another equity roller coaster ride, we are still likely to enjoy gains, albeit at a more moderate, “normal” pace.
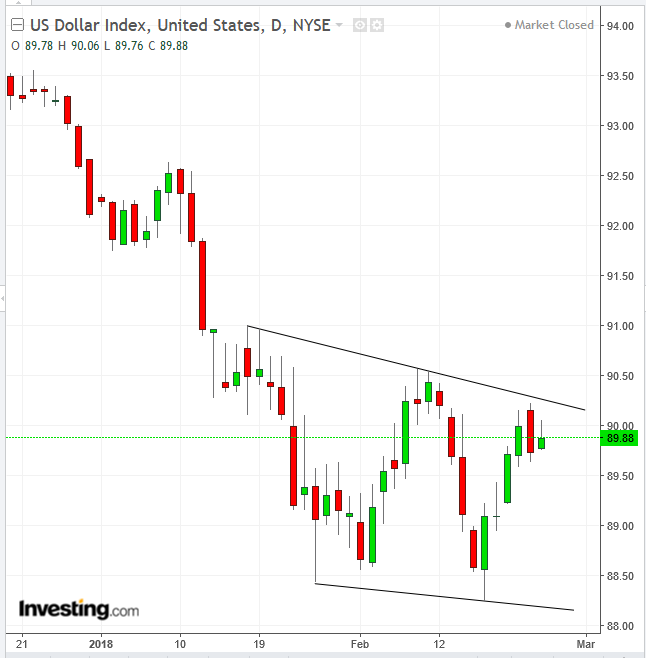
Goldman Sachs says the dollar’s downfall isn’t about the twin US deficits or Trump’s weak dollar policy. According to the investment bank it's nothing more than comparative analysis to Europe and Japan, whose turnarounds are supported by faster economic growth, something we have been saying since June 2017.
Technically, bulls and bears have been coming up in each other’s faces, with a consolidation since January 15. The direction of the range breakout will likely determine the next major move, of at least 2 percent, the height of the smaller part of the pattern.
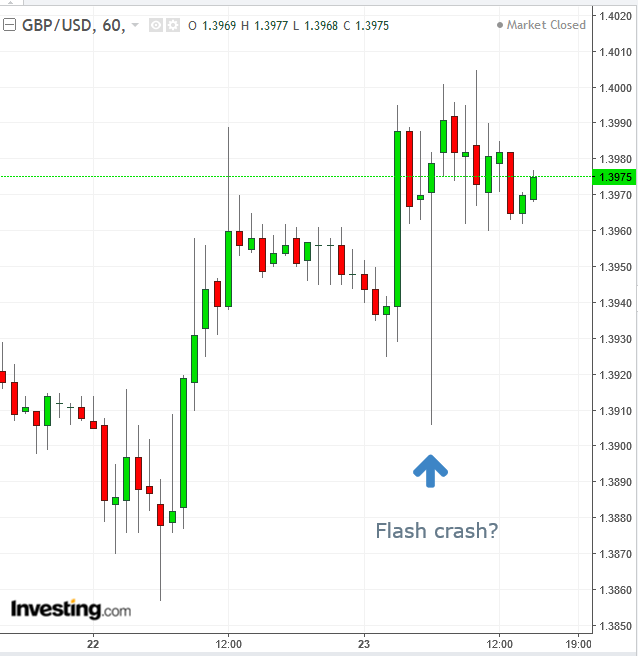
Sterling dropped about 60 pips on Friday, before bouncing right back, with no apparent explanation. The sentiment was positive as Brexit negotiations were going relatively well. While it may be nothing more than a “fat finger,” we urge traders to be on the lookout. At times these dramatic moves happen when traders are nervous about something, i.e, the October 2016 pound flash crash on worries of Brexit.
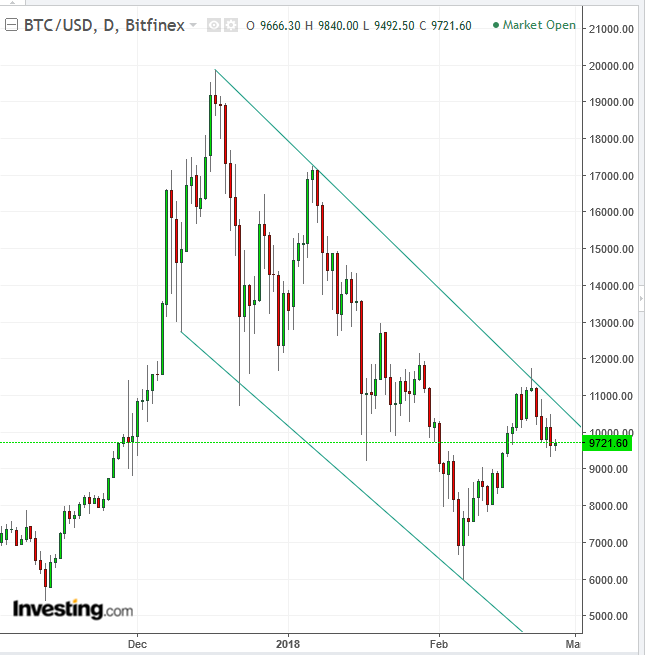
Bitcoin has reaffirmed its falling channel, increasing the probability of retesting its $6,000 previous trough.
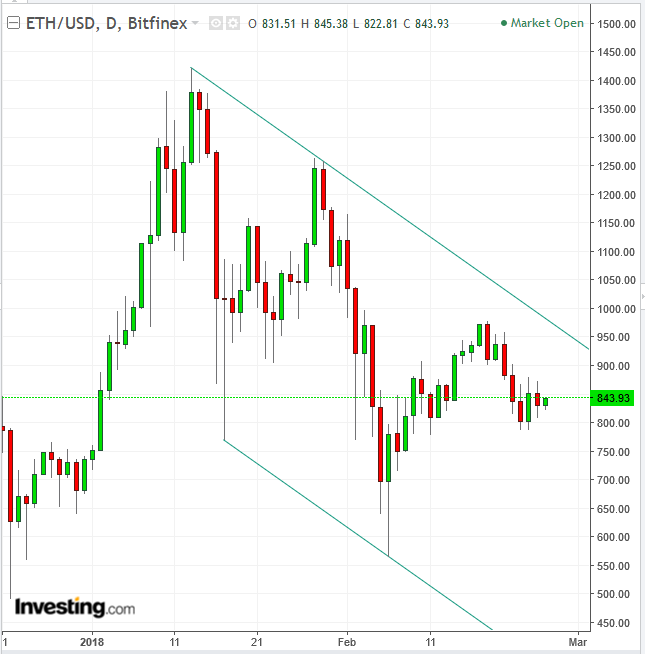
Ethereum is trading within a clear falling channel, suggesting once the price falls below $800 it would retest the $600 level.
The Week Ahead
All times listed are EST
Monday
8:30: US – Chicago Fed National Activity Index (January): expected to fall to 0.22 from 0.27
10:00: US – New Home Sales (January): forecast to rise 2.4% MoM from a 9.3% drop
Tuesday
5:00: Eurozone – Business Climate (February): forecast to hold at 1.5.
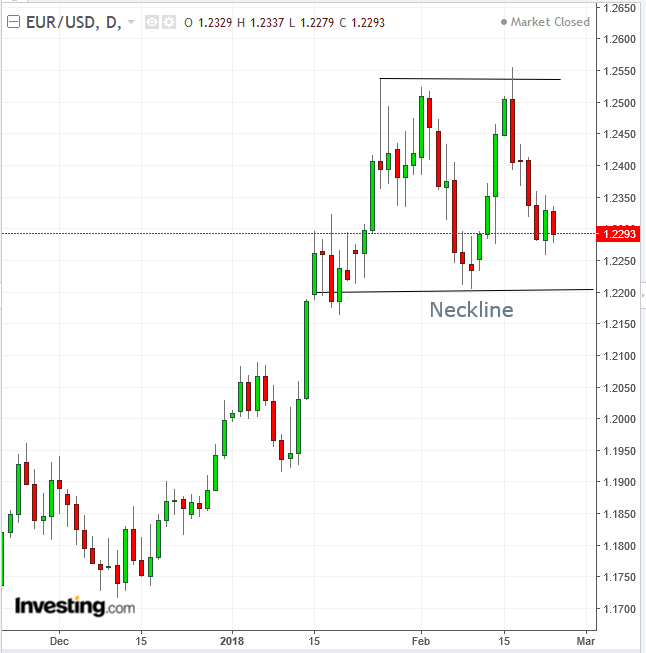
The euro is potentially forming a double top, with a downside breakout beneath 1.2200.
8:00: Germany – CPI (February, preliminary): forecast to rise 1.5% YoY from 1.6% in January.
8:30: US – Durable Goods Orders (January): expected to fall 2% MoM, from 2.9%, and rise 0.2% from 0.6% excluding transportation.
20:00: China – Manufacturing PMI, Non-Manufacturing PMI (February): manufacturing PMI forecast to rise to 51.4 from 51.3, non-manufacturing PMI to fall to 55.2 from 55.3.
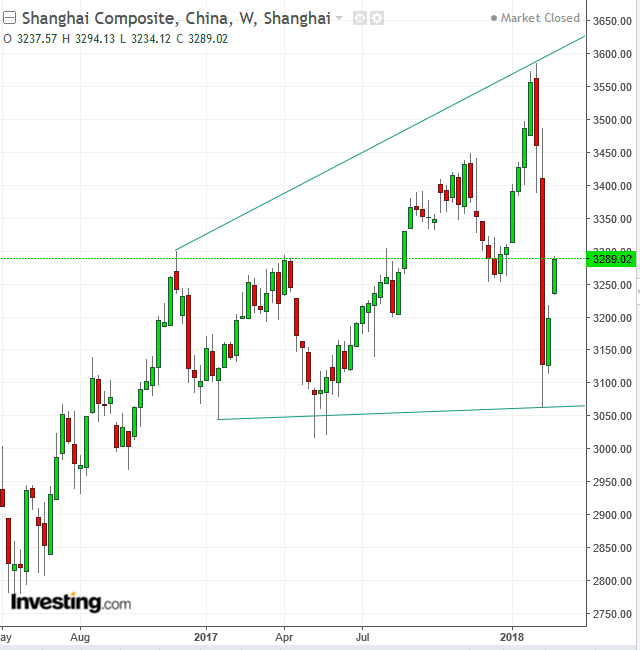
The Shanghai Composite has leaped 1.15 percent on an exceptional weekly gap, for a 2.85 percent advance within a rising pattern, suggesting the price would retest the 3,600 level.
Wednesday
2:00: Germany – Consumer Confidence (March): forecast to fall to 10 from 11.
3:55: Germany – Unemployment Rate (February): unemployment rate to rise to 5.1% from 4.9%, while the number of unemployed falls by 20,000.
5:00: Eurozone – Inflation (February, flash): CPI forecast to rise to 1.3% YoY from 1.2%, while core CPI holds at 1%.
8:30: US – GDP (Q4, 2nd estimate): QoQ growth expected to be 2.5% from 3.2%.
9:45: US – Chicago PMI (February): expected to fall to 64 from 65.7.
10:00: US – Pending Home Sales (January): forecast to rise 0.5% MoM.
10:30: US – EIA Crude Inventories (w/e 23 February): stockpiles expected to rise by 1.2 million barrels.
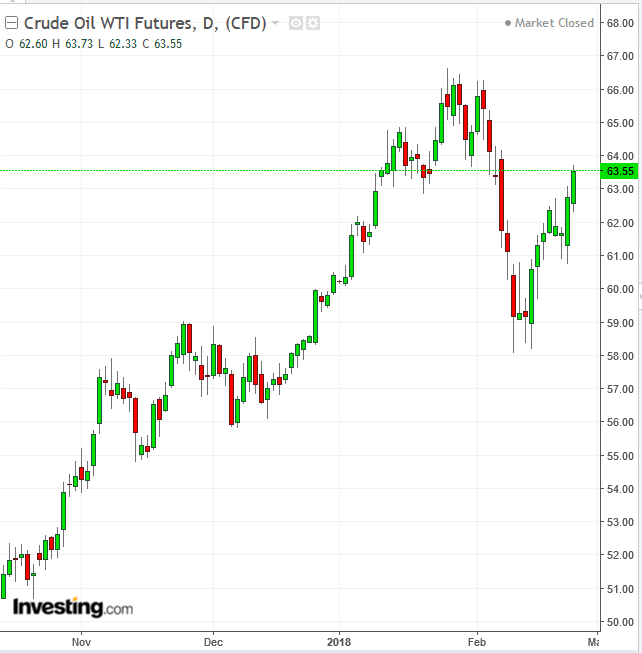
On Friday, WTI crude oil retreated, but remained on track for a second weekly increase that was supported by a surprise pullback in U.S. inventories. Technically, the price needs to post a peak that's higher than the former $66.66 high, registered on January 25.
Afternoon: US – Fed Chair Jerome Powell Testifies: the new chairman will present his outlook on the US economy and Fed policy, to Congress in his first public appearance at the helm of the central bank.
20:45: China – Caixin Manufacturing PMI (February): forecast to fall to 51.2 for the private sector survey, from 51.5.
Thursday
00:00: Japan – Consumer Confidence (February): expected to hold at 44.7.
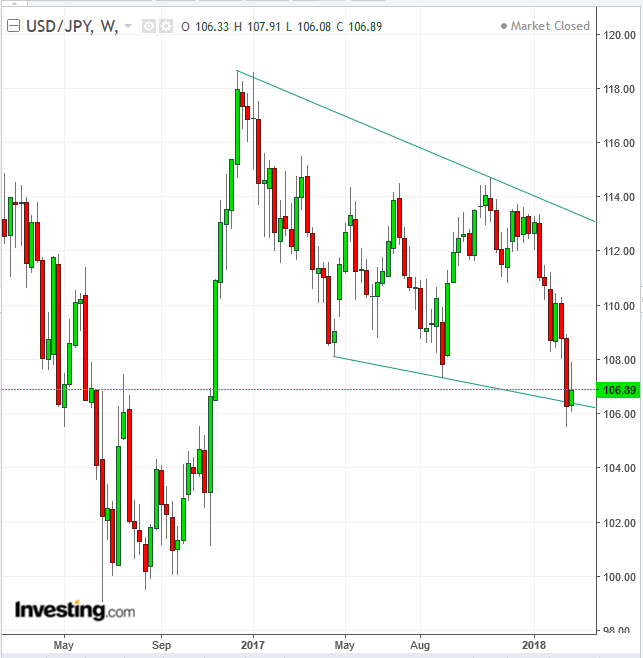
The USD/JPY pair has formed an inverted hammer, with bullish potential, upon confirmation with a higher close than its real body. Such a close may signal a strengthening dollar, toward the top of the pattern. However, traders must realize that its downward tilt clarifies its bias.
4:30: UK – Manufacturing PMI (February): forecast to fall to 55.2 from 55.3.
5:00: Eurozone – Unemployment Rate (January): expected to fall to 8.6% from 8.7%.
8:30: US – Initial Jobless Claims (w/e 24 February): previous reading 222,000.
10:00: US – ISM Manufacturing PMI (February): forecast to fall to 58.6 from 59.1.
Friday
4:30 UK – Construction PMI (February): expected to rise to 50.5 from 50.2.
8:30: Canada – GDP (Q4): expected to be 1.6% YoY from 1.7%.
