- Equity selloff extends for a second week
- Worst consolidation in two years
- Fundamentals, however, remain positive
- Volatility returns
The Week That Was
The US equity selloff, which started at the beginning of February, extended into a second week. It was the sharpest decline the market has seen in two years.
However, it follows an extraordinary rally. This makes it challenging to determine a bottom for a buying point.
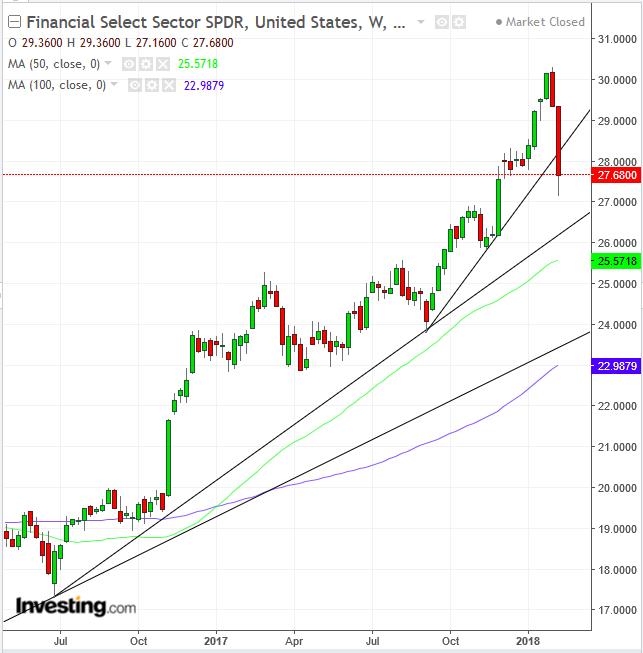
The S&P 500 declined 5.16 percent for the week, led by Financials. The sector saw a staggering 9.53 percent loss in value. On the other hand, Utilities, recently a sector that has consistently lagged, 'outperformed,' down just 2.65 percent.
Fundamentally, there appears to be no specific driver for the equity plunge nor for the underperformance of the financial sector which should, in fact, be a beneficiary of recent economic events.
Higher interest rates should help banks increase earnings. As well, consumer confidence, as measured by the Conference Board, rose to 125.4 from an upwardly revised 123.1 in December, a 17-year high, ensuring consumer financing would additionally support bank earnings. Finally, the National Federation of Independent Businesses (NBFIB) says small business confidence remains at 104.9, a near-record for the 45-year old NFIB Optimism Index, indicating commercial and industrial loans should rise too, also benefiting banks. This of course begs the question, did these sentiment indicators rise in unison with stocks as they hit record levels and will they now fall in tandem as equities experienced their worst sell off in two years.
Technically, the Financial Select Sector SPDR ETF (NYSE:XLF), which tracks the sector, found support above its uptrend line since June 2016 and its 100 dma, while the 200 dma is “on guard” below the uptrend line.
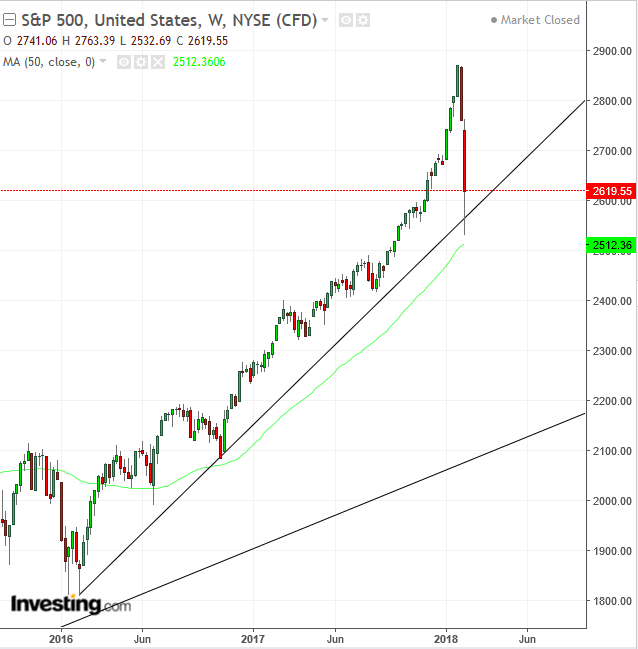
The S&P 500 benchmark index dipped below its uptrend line since February 2016 for the first time but rebounded and closed above it. The popular gauge also fell the farthest below its 50 dma since December 2015. On the weekly SPX chart, however, the 50-week MA is tracing the uptrend line since 2016. The price dipped below the uptrend line but retreated sharply before daring to touch the 50 week MA. Does this demonstrate support?
The underlying reason for higher rates thus far, and into 2018, is the expectation of stronger economic growth, which has led to concerns about rising inflation and more Federal Reserve short-term interest rate hikes. However, with economic fundamentals still healthy, we currently see opportunities to add assets at lower prices.
The Dow Jones Industrial Average fell 8.3 percent, but losses were pared back to 5 percent before Friday's close. In each of the past six trading days, the 30-component index recorded intraday swings exceeding 500 points, including four days with swings greater than 1,000 points
The NASDAQ Composite dropped 8.4 percent, but closed the week a bit higher, down 5 percent. The Russell 2000 fell 7.3 percent, but ended the week down 'just' 4.6, outperforming all other major US indexes.
We continue to maintain our view that nothing has changed fundamentally. This appears to still be an emotion-driven selloff, a knee-jerk reaction to the sudden realization that interest rates are in fact going to rise. This 'aha moment' appears to have hit investors last Friday, when the release of the January employment report, included signs that long stagnant wage growth has started to pick up, increasing to 2.9 percent, the fastest pace since 2009.
This spurred a bond selloff, pushing yields to—ironically—just under 2.9 percent, the same as the wage growth metric. These highest yields in 4 years created meaningful headwinds for stock prices, attracting considerable demand from many investors who were lulled into stocks by the lack of volatility.
Still, all signs show the economy is improving. Corporate earnings have been strong and rates are still historically very low. Nevertheless, unlike long-term investors such as Warren Buffet, traders can see their accounts dwindling, even if the fundamentals don’t justify it.
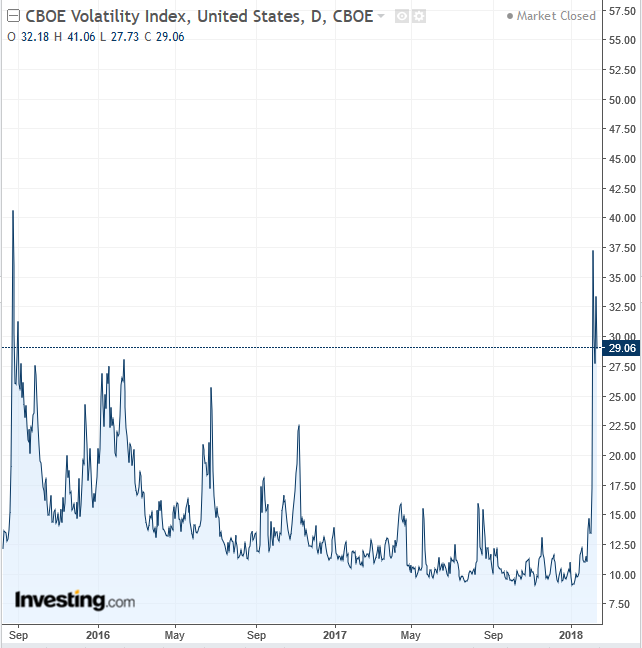
For all these reasons, the story, in fact, is more about the re-emergence of volatility, which has returned to markets and is at the highest point since 2015. Due to the previously calm, if not totally complacent, market environment since 2015, most institutions have entered momentum trading strategies, betting on low volatility.
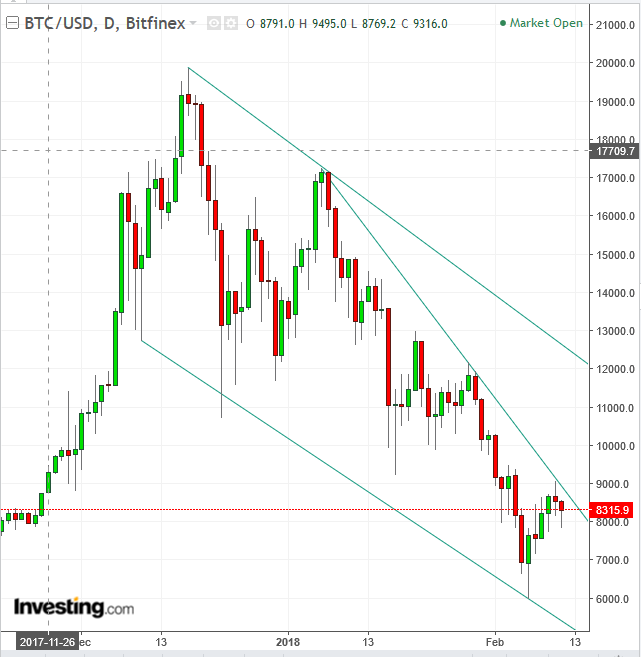
Bitcoin has corrected 50%, from $6,000 to $9,000. This is a good time to remember, that rebound is considered nothing more than an upward correction within a downtrend. In other words, the presumption is for additional declines. Another supposition is that the price may change course from a correction to its prevailing trend, smacking investors over the head with no notice.
The Week Ahead
All times listed are EST
Tuesday
4:30: UK – CPI (January): CPI expected to rise 3% YoY, in line with previous month. Core CPI forecast to be 2.6% YoY from 2.5%.
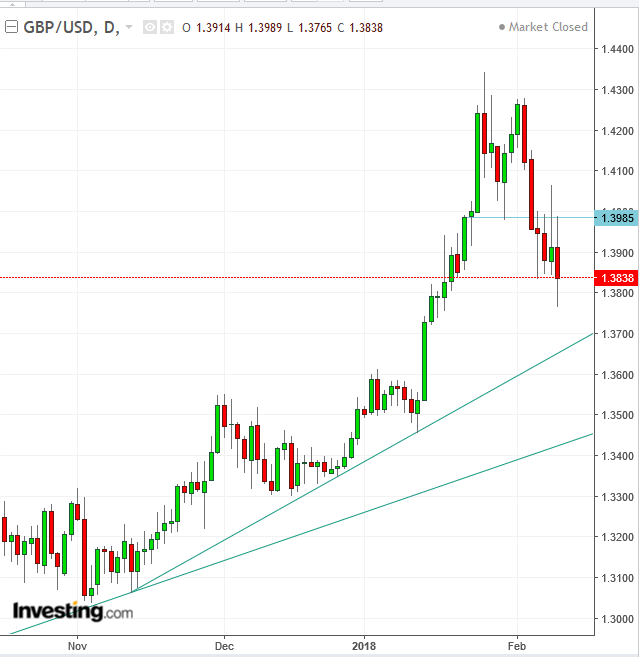
The GBP/USD pair completed a small double top, whose neckline provided resistance for all of last week. The pair trajectory is to the uptrend line since November, at 1.37. Should that break, it would then head to the primary uptrend line since October 2016, at 1.35.
18:30: Australia – Westpac Consumer Confidence (February): previous reading showed sentiment had increased, up 1.8%.
18:50: Japan – GDP (Q4, preliminary): forecast to come in at 0.2% QoQ and 0.9% YoY, from 0.6% and 2.5% previously.
Wednesday
02:00: Germany – GDP (Q4, flash): expected to be 0.6% QoQ and 2.9% YoY, from 0.8% and 2.8% respectively.
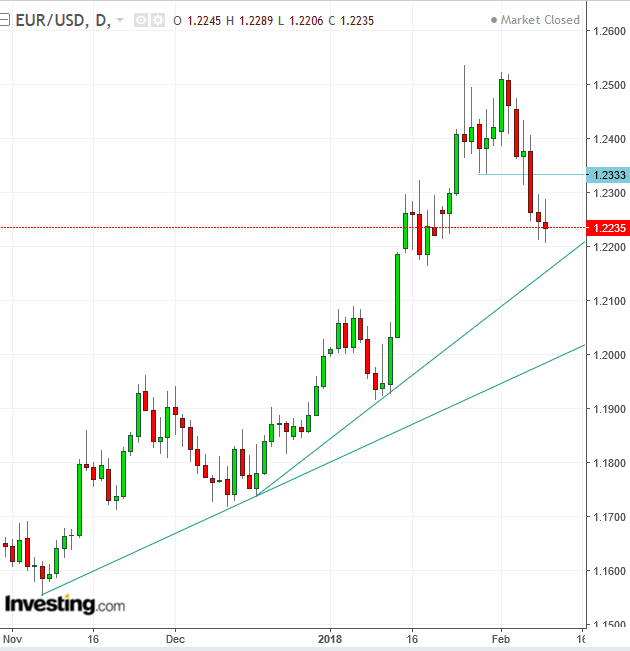
The recent euro weakness, like that of the pound, has been on dollar strength. To that effect, the same pattern emerged: a small double top, followed by a rising trendline since mid-December, below which a rising trendline since November.
05:00: Eurozone – GDP (Q4, 2nd estimate): QoQ growth expected to be 0.6% from 0.7%, while YoY slows to 2.7% from 2.8%.
08:30: US – CPI, Retail Sales (January): price growth expected to be 2.1% YoY and 0.3% MoM, from 2.1% and 0.4% respectively. Core CPI expected to be 0.3% and 1.8%, unchanged from last month. Retail sales expected to rise 0.5% MoM from 0.4%.
10:30: US – EIA Crude Inventories (w/e 9 February): stockpiles expected to rise by 1.8 million barrels, from 1.9 million a week earlier.
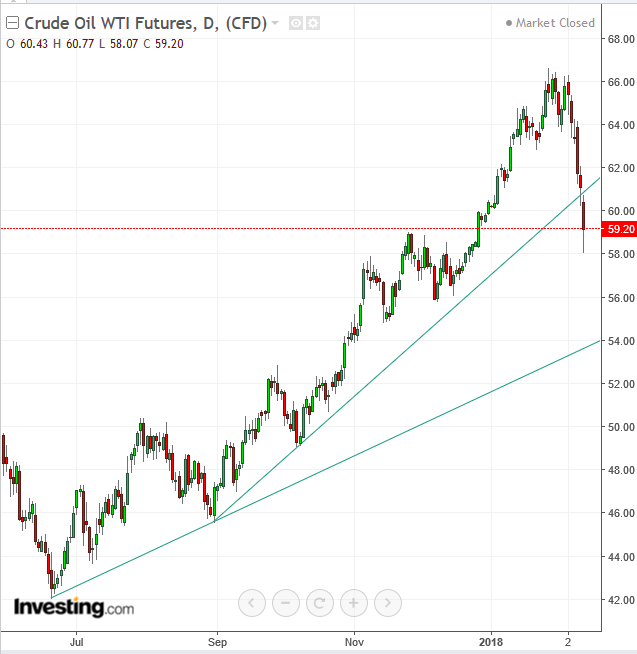
Oil's price has fallen below the uptrend line since September, leaving a trajectory to the uptrend line since June, currently at $54.
19:30: Australia – Employment Data (January): unemployment rate forecast to fall to 5.3% from 5.5%, while 25,500 jobs created, from 24,700 last month.
Thursday
08:30: US – PPI (January) NY Fed Manufacturing Index index, Philadelphia Fed Manufacturing Index (February): January PPI to rise to 0% MoM from -0.1%, while Core PPI to be 0.3% from -0.1%. NY Fed index to be 17.7, in line with last month, while the Philly Fed index to be 22, after a 22.2 reading last month.
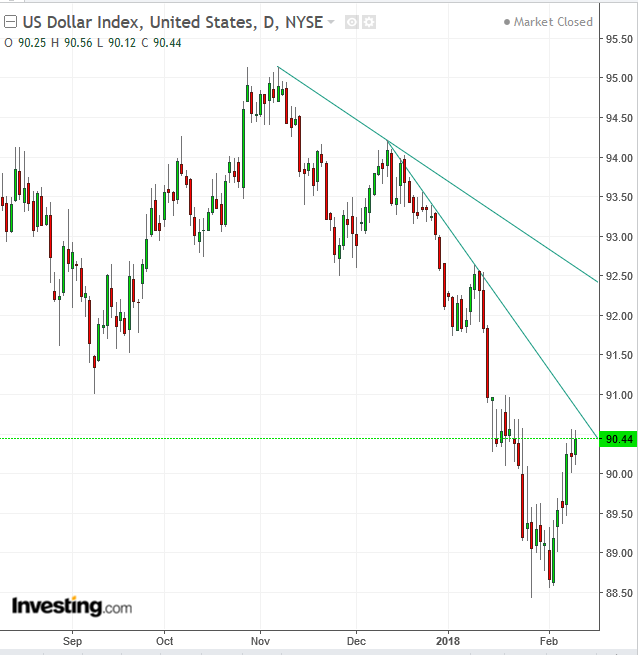
The dollar index found triple resistance at the psychological 90.00 level, mid-January congestion and a downtrend line since December 12.
Friday
04:30: UK – Retail Sales (January): expected to rise 0.3% MoM and 2.2% YoY (excluding fuel), after a 1.6% drop and 1.3% rise respectively in December.
08:30: US – Housing Starts and Building Permits (January): permits to rise to 1.3 million annual rate, with starts up to 1.22 million.
10:00: US – Michigan Consumer Confidence (February, preliminary): forecast to fall to 95.6 from 95.7.
