- Solid jobs data increases pressure on Fed to raise rates
- Rising yields provide outlook for tightening cycle, spurring further Treasury selloff
- Rate outlook causes equity selloff
- S&P 500’s biggest pullback in 404 days
- All sectors in red, with no room to hide
- NASDAQ 100 sees worst week since 2006
The Week That Was
Tightening Catches Up with Equity Bulls
US equity bulls took a major hit on Friday, as the worsening bond rout stirred angst that the Fed will accelerate its rate hike schedule, increasing the cost of borrowing and making it more difficult to keep supporting record equity prices. The Dow Jones Industrial Average fell 2.5%, its steepest one day decline since mid-2016; the S&P 500 tumbled 2.1%; the NASDAQ Composite slipped by 2%.
Solid jobs data—normally a boost to share prices, usually signaling that publicly traded companies would grow with a stronger economy—accelerated the bond selloff as investors increase the selling in hope of reinvesting into bonds with higher yields.
The bond selloff accelerated after Dallas Fed President Robert Kaplan said Friday that the U.S. economy will show further signs of inflationary pressure in 2018 and the Federal Reserve should continue raising interest rates. Coming from someone considered to be a centrist policy maker, this suggests a stronger shift in the Fed’s posture. Yield on the 10-year Treasury jumped above 2.85 percent for the first time since January 2014.
On Friday, neither equity nor bond investors had anywhere to hide. They couldn’t protect their capital in Treasuries during a selloff and all S&P sectors were deep in the red too.
The recent sector laggard, Utilities, was Friday's best performer, losing “just” 2.27 percent in value. Energy underperformed, on both a daily and a weekly basis, falling 4.12 percent and 6.52 percent respectively.
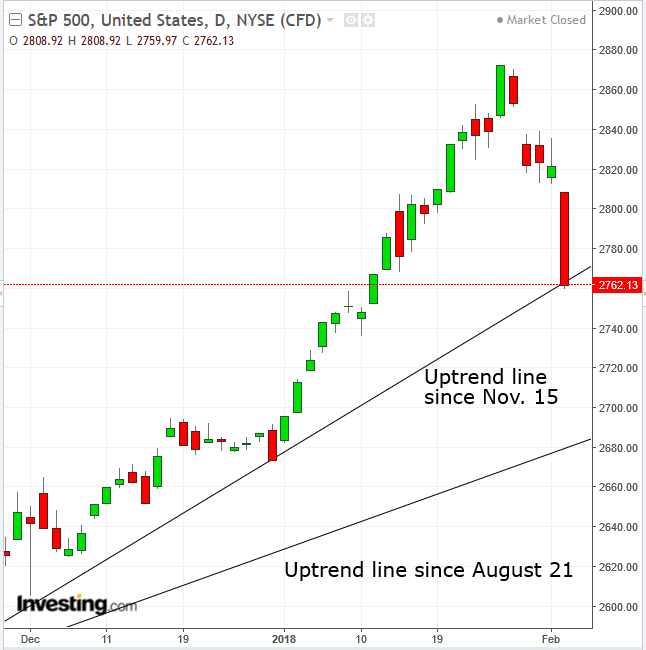
Earnings disappointed and crude oil slumped. The benchmark S&P fell 2.12 percent on the day, 3.85 percent for the week, its largest pullback for the index in 404 days, wiping out two-and-a-half weeks of record gains and paring back almost half of the 2018 advance, from 7.45 percent down to 3.34 percent. The selloff ended when the price found support on the uptrend line since November 15.
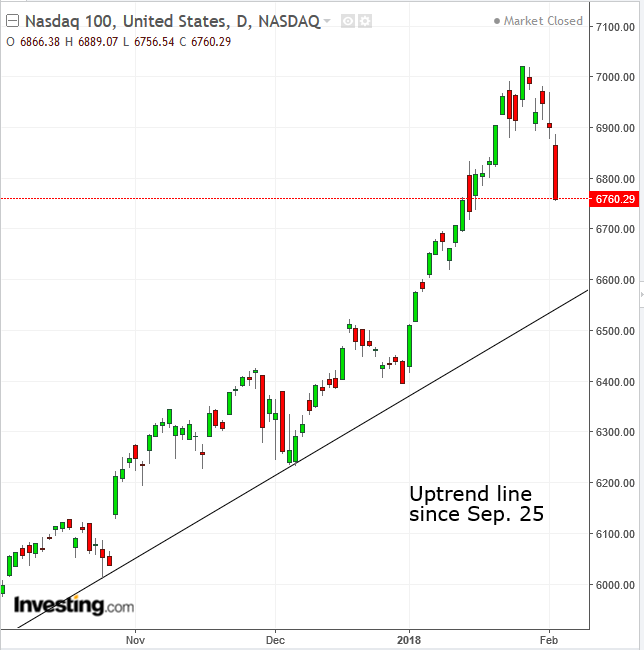
The Tech selloff worsened on Friday, sending the NASDAQ 100 Index lower by 2.1 for a loss of 3.7 percent for the week, the index's worst weekly performance since February 2006.
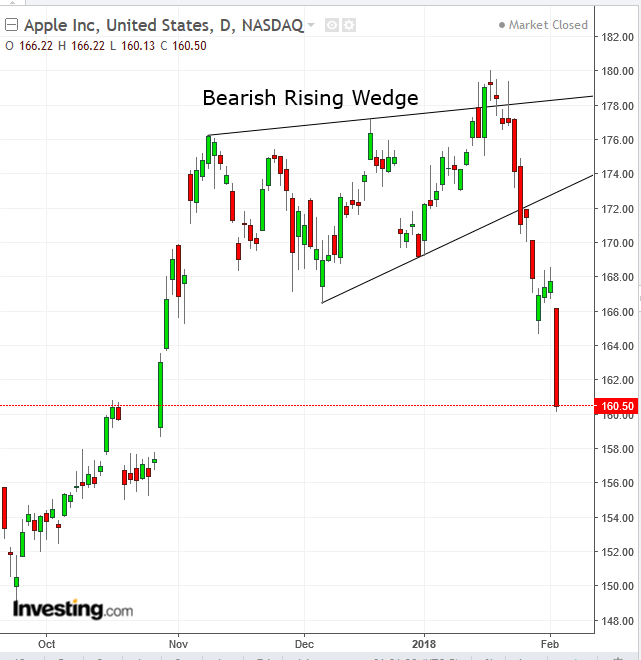
Not even a record rally in Amazon (NASDAQ:AMZN) shares, which gained almost 3% on Friday after the company beat expectations during its report after the close on Thursday, could rescue the NASDAQ. The world’s largest company by market cap, Apple (NASDAQ:AAPL) hit its lowest point since October, after it released weaker than expected guidance for Q1 2018, extending a downside breakout from a bearish Rising Wedge, with an implied $158.00 target.
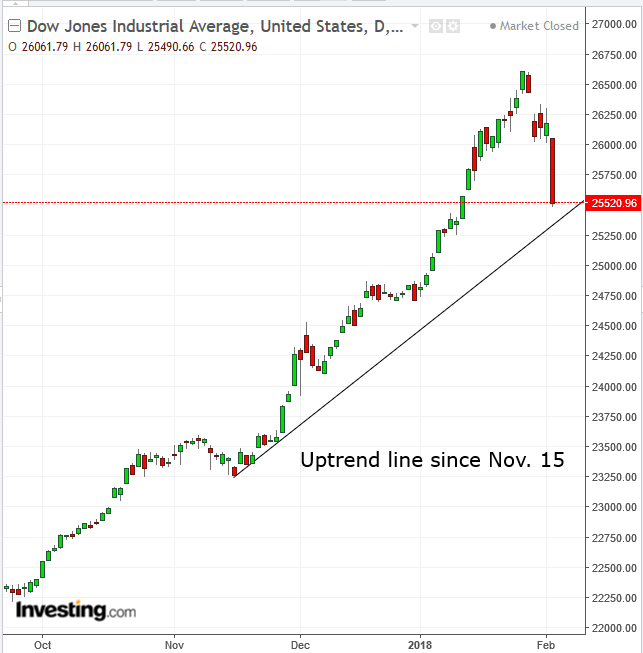
After investors made what might be characterized as a deal with the Devil over the past year and then some, in which the Dow alone hit 96 new record highs since the 2016 presidential election, on Friday he may have come collecting, when the mega cap index plunged 666 points, its biggest fall since June 2016 when the market consensus was that a “Leave” vote in the UK referendum would cause a global disruption in the financial system.
Former Fed chair Alan Greenspan told Bloomberg Television this week that he sees two bubbles forming in asset markets: one in stocks and one in bonds. The bond bubble is the one that concerns him most, he noted. An increase in US government debt relative to the size of the overall economy would lead to the bubble bursting, he said.
US Jobs Growth Accelerates; Wages Finally Gain
US employers hired 200,000 new employees in January, beating the 175,000 consensuses and adding a positive chapter to the global growth story. Most of the gains came from construction, food and drink services, health care and manufacturing.
However, more jobs alone aren’t enough. Wage inequality continues to grow.
In much of last year, healthy job growth was offset by 'unhealthy' wage growth. That has been the single most illusive piece of the puzzle for economists since 2016: why time and again wages didn’t rise in an ever-tightening labor market. According to basic economic principles, an employee’s market—one in which there was more demand for employees than the available individuals to fill the open positions—should logically lead to higher wages, as employer’s fight over the too few potential candidates. But that hasn't been the case.This inexplicable missing component was a central reason for stagnant inflation.
Therefore, the really good news within Friday’s employment report is the average hourly earnings component which grew more quickly than expected, rising by 2.9% year- over-year, the largest boost since 2009. This recoupling of wages to employment provides evidence that inflation is trending upward. The unemployment rate remained at 4.1% for the fourth straight month.
Better-than-expected job growth, compounded by the recent, healthier wage growth pop is expected to propel the Fed along the path of higher interest rates, allowing it to fulfill its mandate of managing inflation. In fact, the Fed already hinted as much in its post FOMC meeting forward guidance statement, changing its previous terminology from “gradual adjustments” in monetary policy and” to “further gradual increases” in the funds rate, perhaps suggesting the central bank's stronger resolve to its prior consideration of tightening.
Europe’s Growth Accelerates Faster Than US but Inflation Lags
The eurozone's GDP grew 2.7 percent, year-over-year, during the final quarter of 2017, while the preliminary reading from the US was 2.3%. While that's encouraging, eurozone inflation came in at just 1.3 percent across the region during January, according to data from Eurostat.
It's ironic that US inflation is on the rise, while that of Europe is stagnant, after the latter region wrested the lead away from China during mid 2017 for strongest global growth, while the US has been lagging throughout. This is likely because Europe is a little bit further behind the U.S. in its economic cycle. The upshot: this creates a nice environment for regional equity markets as there isn’t much pressure on the European Central Bank (ECB) to embark on a more aggressive monetary tightening policy.
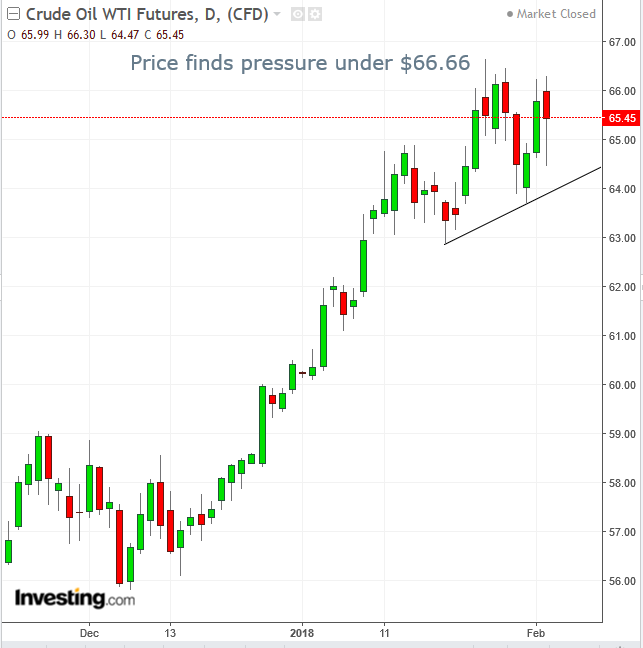
While crude posted its best start to a year since 2006, some traders are bearish on the commodity. US production has been rising, over 10 million barrels a day, the highest level since 1970.
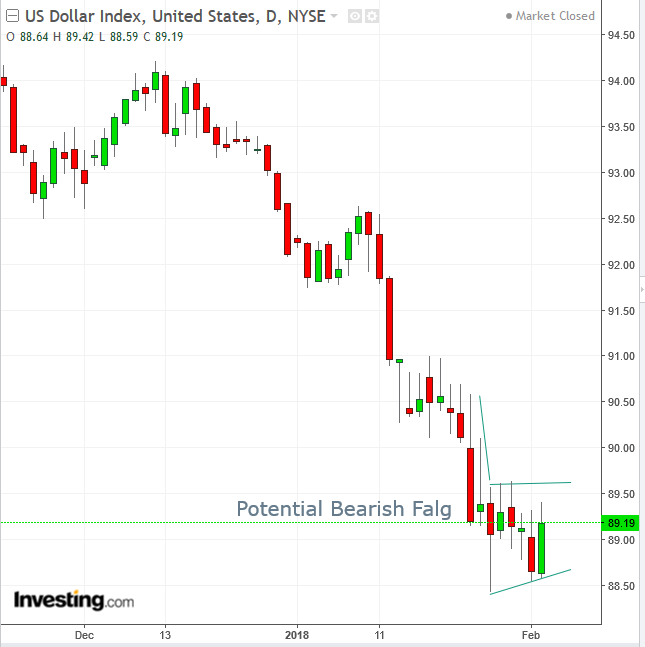
The dollar index gained on Friday, rising 0.56 percent, which helped drive the equity selloff. Despite the fastest tightening policy among the major economies, the dollar is still near multi-year lows, possibly due to the faster growth in Europe and China, funneling investment away from the US.
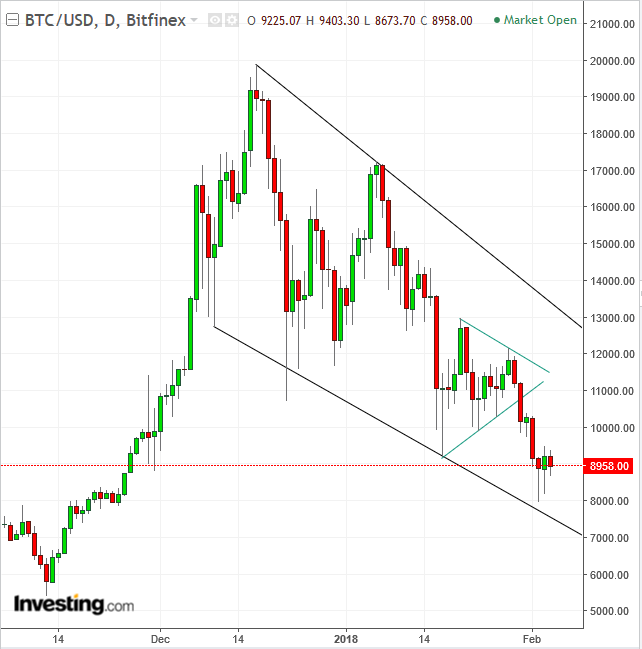
Bitcoin had a disastrous week, last week. The cryptocurrency plunged on Thursday, falling below $8,500, hitting $7,695 before moving higher. Obviously, our short term, $9,000 level was reached. Though the alt-currency has since recovered somewhat, as this article is published BTC is trading at $8,608. We still expect our longer-term, $6,000 target to be reached.
However, there will likely be at least one correction first. On Friday, the most popular digital currency reached a low of $7,972.20 on the Bitfinex exchange and rebounded from the channel bottom, forming a bullish hammer. A correction may retest the January 17-30 pennant at the $11,000 level, while the $10,000 round-psychological number may provide ample resistance as well.
The Week Ahead
All times listed are EST
Sunday
20:45: China – Caixin Services PMI (January): private sector growth expected to accelerate, with the index rising to 54.1 from 53.9.
Monday
4:30: UK – Services PMI (January): expected to fall to 53.8 from 54.2.
10:00: US – ISM Non-Manufacturing PMI (January): forecast to rise to 56.3 from 55.9.
22:30: Australia – RBA Rate Decision: no change in rates expected.
Tuesday
8:30: US – Trade Balance (December): deficit expected to rise to $51.7 billion from $50.5 billion
10:00: Canada – Ivey PMI (January, seasonally-adjusted): forecast to fall to 59.2 from 60.4.
Wednesday
10:30: US – EIA Crude Oil Inventories (w/e 2 February): stockpiles expected to fall by 480,000 barrels, from a 6.78 million increase a week earlier.
15:00: New Zealand – RBNZ Interest Rate Decision, Monetary Policy Statement, Rate Statement, Gov Spencer Speaks: rates expected to remain unchanged at 1.75 percent.
Thursday
00:04: China – Trade Balance (January): exports forecast to rise 9.1% year-on-year, from a 10.9% growth in December.
07:00: UK – BoE Rate Decision and Inflation Report: the bank is expected to keep rates unchanged, but the statement, minutes and inflation report are all vital as they give insight into the outlook and will likely prompt sterling volatility.
20:30: China – CPI (January): price growth expected to fall a bit, to 1.5% YoY, from 1.8% last month.
Friday
4:30: UK – Trade Balance (December): deficit expected to narrow to £2.5 billion from £2.8 billion.
8:30: Canada – Employment Data (January): unemployment rate forecast to rise to 6% from 5.7% while 45,000 jobs expected to have been created, from 78,600 last month.
