- US stocks continued to rally last week
- Headline GDP disappointed
- Consumer Spending, Business Investment increased
- Dollar fell to 3-year low
- (1) More imports than exports – why US President Donald Trump is fighting to push the US dollar lower – leading to a trade deficit gap for the fourth quarter and
- (2) A business inventory drawdown which occurs when company's don’t resupply inventories. It takes away from the number of transactions that make up the GDP number.
The Week That Was
US stocks extended their rally last week, for a fourth straight week. The driver was stronger than expected Q4 2017 earnings results as well as likely optimism on recent US tax reform legislation which improved economic growth prospects and boosted positive 2018 guidance for companies.
All four major US indices—the S&P 500,Dow, NASDAQ Composite and Russell 2000—advanced on Friday to set new records. Except for the Dow Jones Industrial Average, which hit a new weekly high on Thursday, the remaining three indices each managed a weekly gain, courtesy of Friday’s surge.
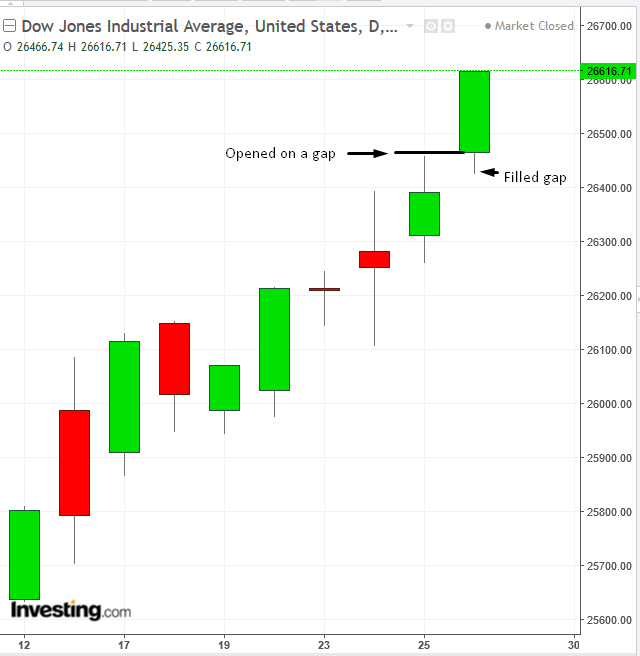
Both the S&P 500 and the Dow opened higher to start the week. While the higher open on the SPX wasn’t considered a gap, since both Wednesday’s and Thursday’s intraday price action had seen those levels, it was uncharted territory for the Dow and therefore a gap. However, the gap filled, which may be viewed as a more stable advance than a gung-ho rush to buy stocks without testing the environment.
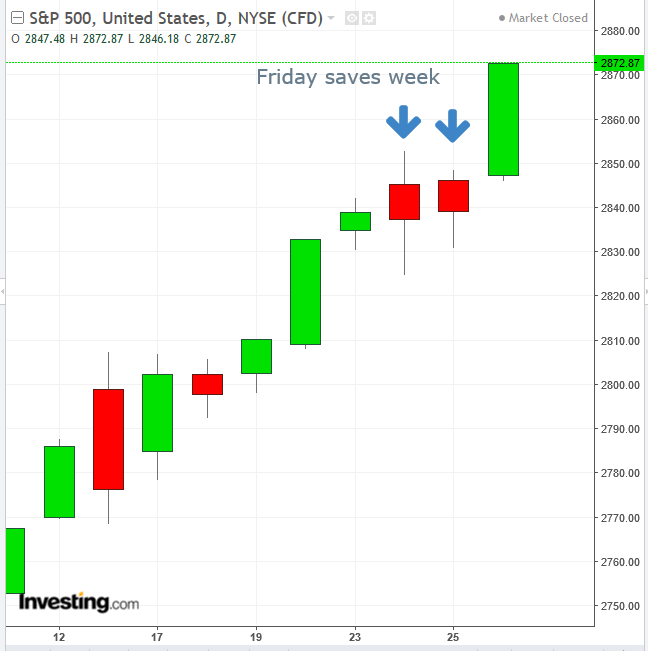
The S&P 500 moved higher on Friday, up 1.18 percent—the index's biggest daily gain since March—adding 2.23 percent for the week. Internally, every single sector was in the green, both on Friday as well as for the week. Healthcare took to the lead both on Friday, +2.15 percent, and for the week, up 3.51 percent. Friday's laggard sectors were Utilities, which clawed its way into the green by a mere 0.06 percent; the weekly laggard was Consumer Staples, up 1.17 percent.
US Q4 GDP
Friday's Q4 GDP release disappointed. The headline 2.6% was below expectations. Analysts anticipated it to have been upward of 3 percent growth. Two things responsible for the missing half-percent of the GDP outlook were:
Parenthetically, while reduced inventories may suggest pessimism on the part of businesses regarding their ability to move product, this in fact is a very volatile number from quarter-to-quarter and therefore reflects nothing in the short term. While GDP is a handy number to toss around, it does not accurately asses economic growth, as it is nothing more than a transaction counter, not a wealth calculator.
If the same product was sold back and forth between the same parties, each transaction would increase GDP, while the wealth created would remain the same. Therefore, other than boosting sentiment, GDP is not a very reliable indicator for economic growth. So what would be?
Consumer spending, reflecting consumer confidence, was up 3.8 percent for the quarter. Business investment increased 11 percent for the year.
During this earnings season, so far, revenues have surprised, mostly to the upside. Of the companies that have reported so far, 81 percent have beaten expectations on revenue. Compare that to the old normal for earnings season wherein 50% of companies surprise to the upside.
So far all indications point to both the US and the global economy growing. Inflation—the one piece of data that has been eluding the US economy—was up 1.9 percent, excluding volatile energy and food, increasing the outlook for at least 3 rate hikes this year.
As we said above, the S&P advanced 2.23 percent for the week, while the Stoxx Europe 600 remained flat. The US economy, though growing, continues to lag Europe. Why then are US stocks more bullish?
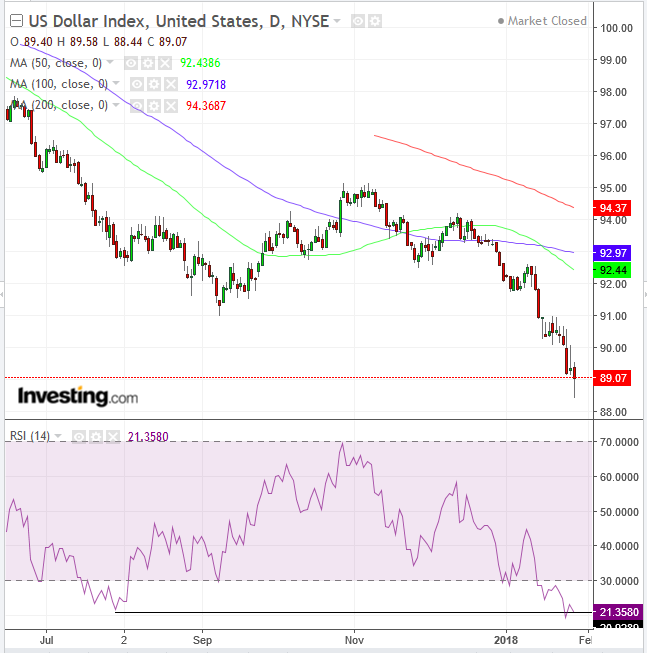
It’s quite possible that the US stock rally, now in its fourth week, has more to do with the falling dollar—to the tune of 1.65 percent for the similar period—than because of actual investor bullishness over US stocks, which have already climbed for three straight weeks, even through the possible rise of a trade war.
The greenback fell to a three-year low this past week, wiping out the surge generated by Trump’s verbal support of a strong currency on Thursday, which followed Treasury Secretary Steven Mnuchin’s endorsement of a weak dollar just a day earlier.
The dollar completed a sixth consecutive weekly decline, reaching its most oversold level since July 31, 2017. Bulls managed to push the price back from a low of 88.44 to close at 89.07, potentially forming a bullish hammer, suggesting a correction.
On Thursday, ECB President Mario Draghi conceded that the European economy expanded more than expected while trying to temper speculation on the euro. Some believe he didn't do enough to hold the single currency back; the euro’s sixth straight week of advances is hurting the region’s exports and is likely to slow down economic growth.
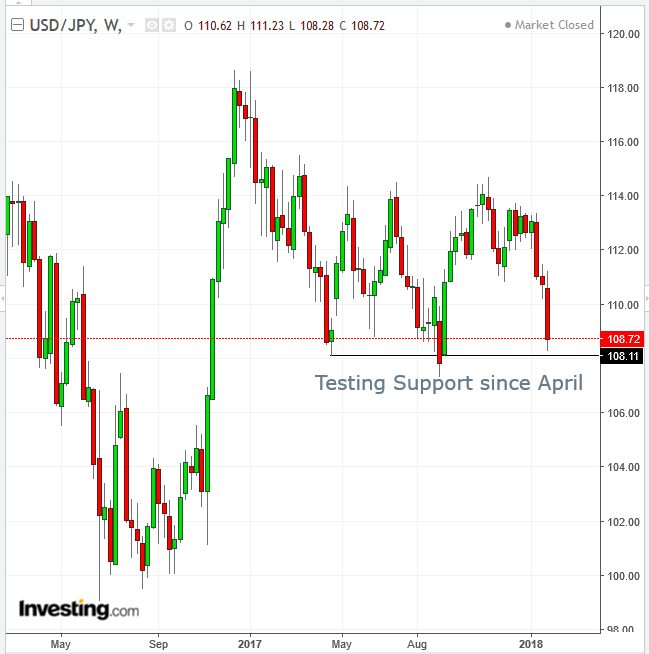
Over the course of last week, the yen had its strongest showing versus the dollar since September, after Bank of Japan Governor Haruhiko Kuroda, speaking in Davos, commented on inflation finally moving toward the BoJ's 2% target. The Japanese currency later pared gains when a spokesperson clarified that Kuroda hadn't revised the price outlook in his Davos remarks.
The price is testing the 1.08 support level since April. A downside breakout would imply another down move toward the 100.00, whereas a higher close would suggest a bounce back toward the 114.00 range top.
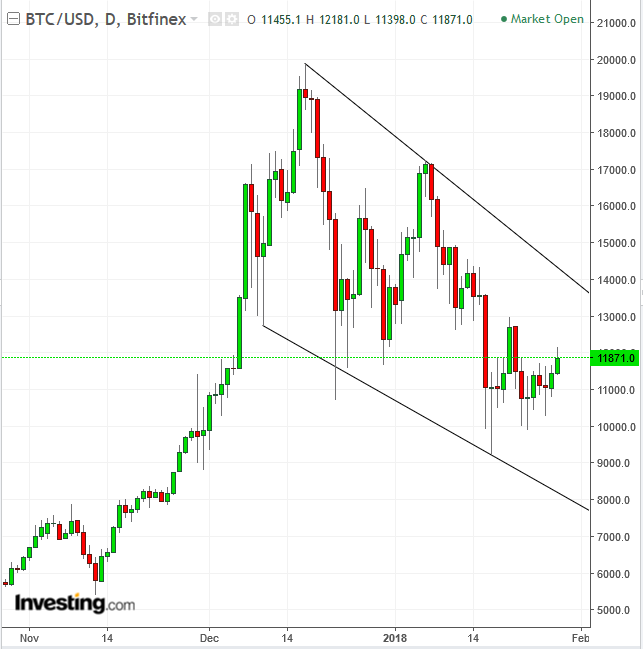
Bitcoin has managed to break out of its sluggish range, around the $11,500 area, beneath which it was being traded during all of last week.
At 01:00 EST this morning it peaked above the $12,000 level but apparently didn’t like what it saw, dropping back down beneath the $11,900 level. The current rise is considered a correction within a downtrend since it is trading within a falling channel.
The Week Ahead
All times listed are EST
Monday
8:30: US – Personal Spending (December): forecast to rise 0.4% from 0.6% MoM.
18:30: Japan – Unemployment Rate (December): YoY rate expected to rise to 2.8% from 2.7%.
19:30: Australia – NAB Business Confidence (December): expected to rise to 10 from 6.
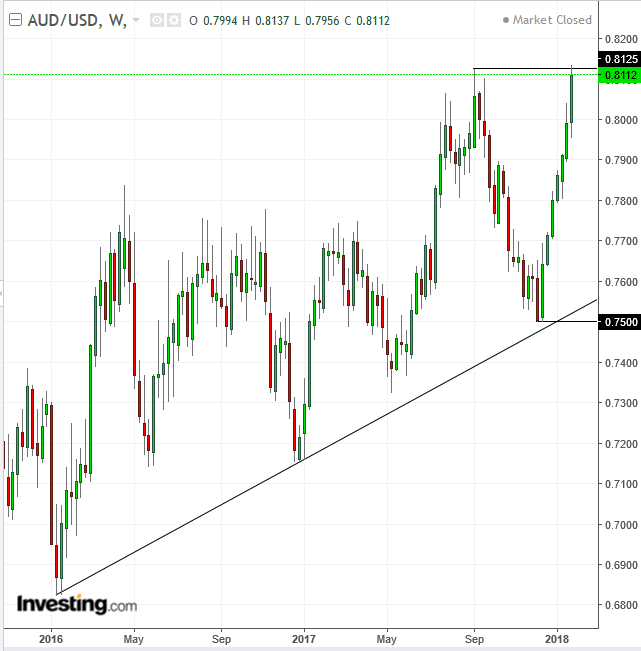
While last week saw the AUD/USD price register a new high, it failed to close above that, leaving the potential for a double top, with the 0.7500 neckline, or at least a correction toward the uptrend line since January 2016.
Tuesday
1:30: France – GDP (Q4, 1st estimate): growth expected to slow to 0.5% QoQ from 0.6%.
5:00: Eurozone – GDP (Q4, flash): forecast to be 0.6% QoQ from 0.6%, and 2.8% from 2.6% YoY
8:00: Germany – CPI (January, preliminary): expected to be 1.8% from 1.7% YoY.
20:00: China – Manufacturing and Non-Manufacturing PMIs (January): these official numbers are forecast to see manufacturing activity hold at 51.6, in line with last month. Non-manufacturing PMI expected to fall to 54.9 from 55.
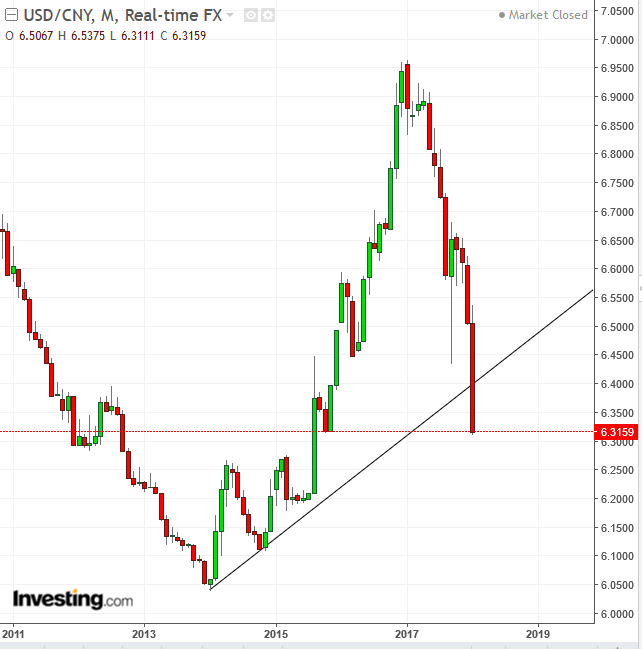
The USD/CNY price fell below the long-term uptrend line since January 2014, potentially signaling a continued downtrend move, should the price fail to climb back above the uptrend line.
Wednesday
Midnight: Japan – Household Confidence (January): expected to rise to 44.8 from 44.7.
3:55: Germany – Unemployment Change (January): expected to fall by 16,000, with the unemployment rate remaining at 5.5%.
5:00: Eurozone – Inflation (January), Unemployment (December): CPI forecast to be 1.3% YoY from 1.4%, while the unemployment rate falls to 8.6% from 8.7%.
8:15: US – ADP Nonfarm Employment Change (January): 180K jobs expected to have been created, from 250K last month.
9:45: US – Chicago PMI (January): expected to fall to 64.5 from 67.6.
10:00: US – Pending Home Sales (December): forecast to rise 0.3% MoM from 0.2%.
10:30: US – EIA Crude Inventories (w/e 26 January): stockpiles forecast to fall by 1.6 million barrels, from a 1.07 million barrel drop a week earlier.
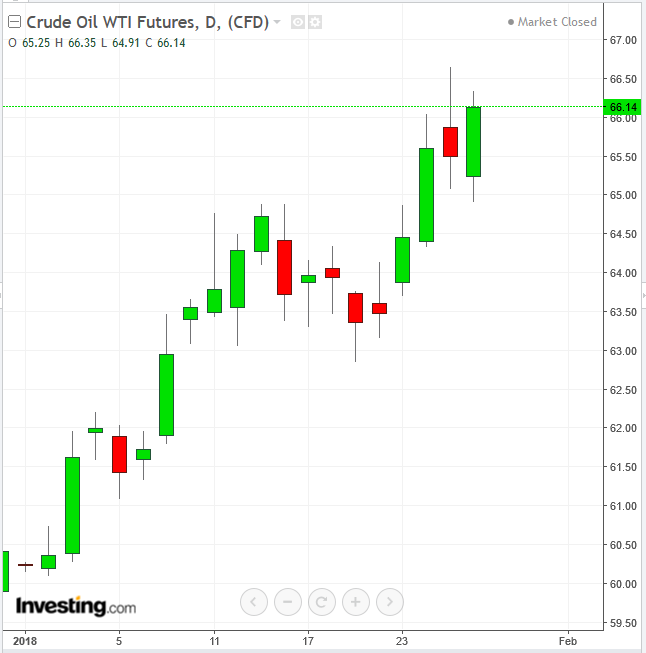
While oil closed the week at $66.14, the highest since December 4, 2014, it failed to close above Thursday’s High Wave candle, whose price action projects a lack of leadership among traders and appears before reversals. Proceed with caution, employing tight trading parameters.
14:00: US – FOMC Statement: no change expected at this, Janet Yellen’s last meeting as Chairperson. However, watch for any hints that more than three rate increases may be possible this year.
20:45: China – Caixin Manufacturing PMI (January): activity expected to slow, with the index falling to 50.6 from 51.5.
Thursday
9:30: UK – Manufacturing PMI (January): activity forecast to increase, reflected in an increase to 56.5 from 56.3. Market to watch: GBP crosses
15:00 US – ISM Manufacturing PMI (January): forecast to fall to 59 from 59.7. Markets to watch: US indices, USD crosses
Friday
4:30: UK – Construction PMI (January): forecast to fall to 51.9 from 52.2.
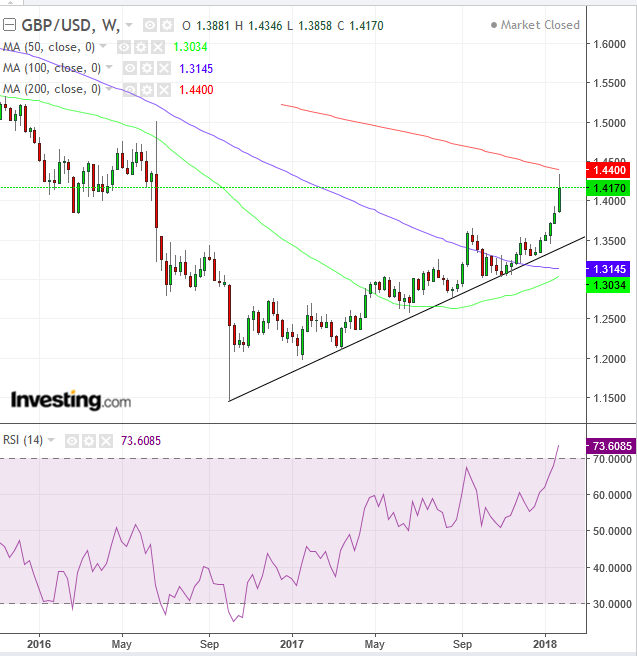
The pound has hit its highest point since the June 2016 Brexit vote, as it reached its most overbought level since July 2014. AS well Cable is nearing – and receding from – its 200 weekly moving average (red), suggesting a correction toward the 1.3500 uptrend line since October 2016.
8:30: US – Nonfarm Payrolls (January): 175K jobs expected, from 148K last month, while the unemployment rate is expected to remain at 4.1%. Average hourly earnings forecast to rise 0.3% MoM, in line with last month.
