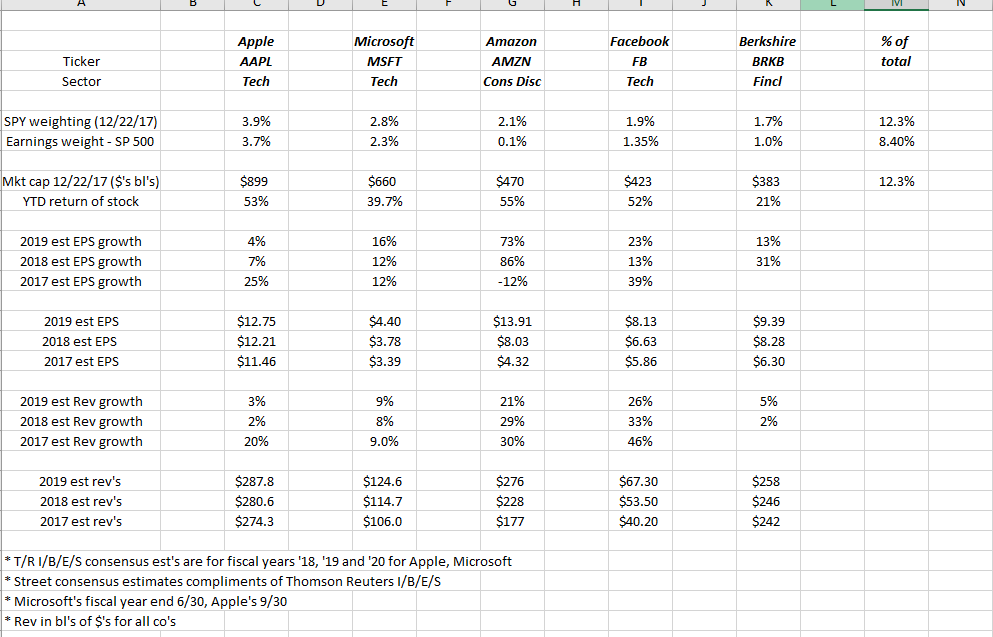
Once a year, looking at the top market cap weights in the S&P 500 can provide some insight into the equity market’s key benchmark. The last time this was written about was here, in August ’16, or about 16 months ago.
Looking at the current Top 5 positions in the S&P 500 by market-cap weight, Exxon Mobil (NYSE:XOM) and Johnson & Johnson (NYSE:JNJ) have fallen out of the Top 5 while, Facebook (NASDAQ:FB) and Berkshire (NYSE:BRKa) now join the group.
While Amazon (NASDAQ:AMZN) is a member of the NYSE:Consumer Discretionary sector, with the Cloud component of its business, some think of it as a NYSE:Technology sector component, so you could make the case that Technology now has 4 of the top 5 names in the S&P 500.
Apple’s (NASDAQ:AAPL) market cap is now $900 billion, but note how the revenue and EPS estimates fall off (again) in terms of growth after the iPhone 8 and iPhone X are launched. Apple has seen this pattern with the last two iPhone launches: strong growth the year of introduction and then “average” growth in the next two years, and the stock typically follows this roller-coaster.
Summary / comments / conclusion: The most important stat in the data is that the Top 5 market-cap weights in the index are now 12% of the S&P 500’s market value, versus 10% in August ’16. Think about that a minute: five of the S&P 500’s stocks are 12% of index or 1% of the stocks represent 12% of the market value of the S&P 500.
That’s why this question was asked earlier this year.
Strategas Partners came through Chicago this year, Jason Trennert, Adam Barabell, and the panel did a good job, but the firm used the term “peak passive” to talk about the move to indexing and ETFs in terms of retail investing.
Talking to individual investors as I sometimes do when the topic comes up in casual conversation, I sometimes think individuals think indexing or ETFs are somehow resistant or are some bear-market panacea that won’t lose value in times of duress.
The Technology, Financial and Health Care sectors are now 23%, 15% and 15% of the market cap weights of the S&P 500 respectively. Just owning those three sectors, readers can get over 50% of the exposure to the S&P 500. Utilities, Basic Materials, Telco, and Real Estate are roughly 12% of the market-cap weight of the S&P 500.
Given the outperformance of Tech and large-cap growth in 2017, clients have seen their Technology weighting reduced while the Financial sector weighting in client accounts has been lifted. Financials are overbought for sure, but the sector trades about 1.5(x) price-to-book, (per Bespoke’s year-end report), and it is considered a “value” sector, and value has been out of favor in terms of relative performance for quite some time.
If you own any index fund, ETF or mutual fund, know what it’s invested in and what is driving it.
