
There is a saying on Broad & Wall that, “Bulls climb the stairs while Bears take the elevator.” There seemed to be a role reversal this week, as the Bulls took the elevator. Is it Game Over for the Bears or do they make a comeback? Next week may provide an answer.
In the meantime, U.S. farmers are facing the wettest planting season in U.S. history, a catastrophic trade war with China and economic conditions that are brutal for small farms has produced a “perfect storm” for U.S. farmers. Normally by this time farmers are praying for rain to make their crops grow. This year they are praying for the rain to stop.
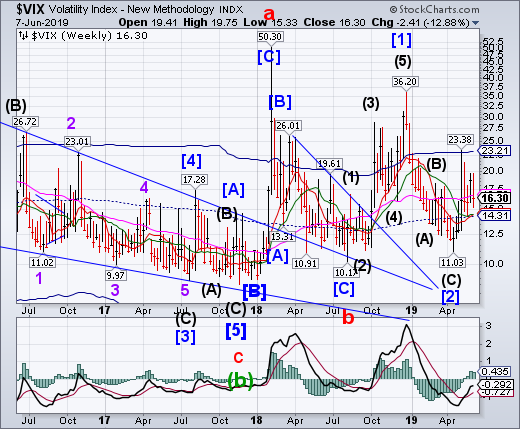
VIX consolidated this week, slipping beneath Long-term support/resistance at 16.73, making an important Cycle low this week. This allows the Cycles to reset and resume their climb. Since the VIX remains calm this week, the media have chosen to ignore it.
SPX rallies, retracing 69%

US500 made a new low on Monday, then rallied, retracing 69% of the decline from May 1. The showdown at Broad & Wall is now playing with the Bulls dominating this week. However, Short-term resistance at 2878.31 has not been taken out and a new sell signal may be had at a decline beneath Intermediate-term support at 2845.44. “Point 6” remains beneath the December 26 low.
(Bloomberg) For all the shine and sophistication, for all the jargon, algos, robots and quants, financial markets are still only this: Buyers buying and sellers selling, times a billion.
Behind every trade — perhaps far behind — there is an actual human person. Two, in fact. And because humans disagree a lot, markets do too.
And do they ever disagree just now.
NDX retraces 55.6% of its decline

NDX rallied to challenge Intermediate-term resistance at 7401.79, closing above it, making a 55.6% retracement of the decline starting May 1. The NDX may not be safe yet, as many of the dominating tech companies have suffered heavy losses last month. The Cycles Model suggests the decline may resume through mid-July.
(MarketRealist) The tech-heavy NASDAQ Composite rose for a third straight session yesterday after a period of losses, by 0.53% to 7,615. Stocks were helped by global central banks’ dovish stance boosting investor confidence. The European Central Bank said that it is maintaining its rates for now. Ten-year German bund yields have fallen to a new low of -0.24%, and ten-year Treasury yields are at +2.12%.
Accommodative monetary policy rescues stocks
The Fed is now mulling over cutting rates. Loose monetary policy has been one of global stock markets’ biggest drivers for the last decade. The Fed’s decision to avoid hiking rates earlier this year gave US stocks one of their best quarters. That rally was driven by multiple expansion rather than earnings growth.
High Yield Bond Index retraces 60%
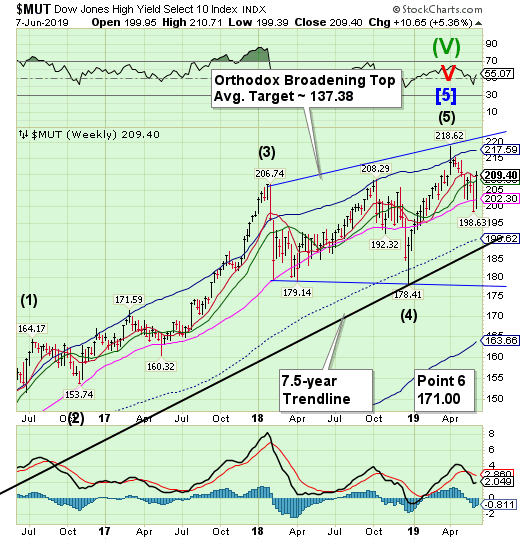
The High Yield Bond Index rallied sharply, retracing over 60% of its two-month decline. It appears that high yield bonds took the elevator going back up after a leisurely stroll down. The Cycles Model warns the next step down may be a large one.
(MarketWatch) The U.S. market for high-yield corporate bonds followed stocks higher on Friday after a disappointing jobs report bolstered hopes that more economic stimulus could be on the way.
The number of new jobs created in May reached only 75,000, well below expectations for a gain of 185,000 predicted by economists. While that could make it harder for workers looking for a paycheck, the immediate reaction has bullish for debt-laden companies.
Corporate debt rated below investment-grade, or so-called junk bonds, have made significant gains this week on surging expectations that the Federal Reserve will cut interest rates to help give steam to an economy shadowed by the prospects for a global trade war.
Treasuries make a 20-month high

The 10-year Treasury Note Index continues to rally, nearly matching the 2017 high. It remains on a buy signal with a potential target at the Cycle Top resistance at 127.98. The Cycles Model suggests the rally may continue through mid-June. Its time to be ready for a reversal in the next week or so.
(CNBC) Treasury yields fell Friday after the U.S. government said the economy added far fewer jobs than expected during the month of May.
At around 8:48 a.m. ET, the yield on the benchmark 10-year Treasury note, which moves inversely to price, was lower at 2.055%, while the yield on the 30-year Treasury bond was down to around 2.571%.
The Labor Department’s report showed that job creation slowed in May, with nonfarm payrolls up just 75,000 even as the unemployment rate remained at a 50-year low. The decline was the second time in four months that payrolls increased by less than 100,000 as the labor market continues to show signs of reaching maximum employment and weaker month-over-month gains. Economists polled by Dow Jones had expected 180,000 jobs.
The euro rallies above Intermediate-term resistance

The EUR/USD broke out of its declining feedback loop this week to test Long-term resistance at 113.73. A daily close above Long-term resistance extends the rally. However, should a reversal occur the neckline may be tested. Cyclical strength may not reappear until the end of June.
(Reuters) – The U.S. dollar index fell on Friday to its lowest since March 26 after the U.S. Department of Labor’s employment report showed that job growth slowed sharply in May and wages rose less than expected.
The weak data suggest that the loss of momentum in economic activity has spread to the labour market, which will further support forecasts that the Federal Reserve will cut interest rates this year. Rising expectations of a cut have pulled the dollar 1.2% lower this week.
“It’s a soft report. It’s a soft enough report that a June rate cut should probably be on the table for discussion,” said Greg Anderson, global head of foreign exchange strategy at BMO Capital Markets in New York.
Euro Stoxx bounces off Long-term support

Note: StockCharts.com is not displaying the Euro Stoxx 50 Index at this time.
The Euro Stoxx 50 SPDR rallied from Long-term support at 36.14 this week, challenging the mid-Cycle resistance at 37.93. The sell signal is lifted, but may be reinstated beneath Short-term resistance at 37.69. The Cycles Model suggests up to 5 weeks of decline may lie ahead.
(Reuters) – European stocks posted their best weekly performance since early April on Friday, aided by strong gains in Paris, against a backdrop of hope among investors that central banks would support global growth with more accommodative policies.
The Bundesbank slashed its growth projections for Germany and euro zone money markets now price in a 60% chance of the European Central Bank cutting interest rates by 10 basis points by year-end, while U.S. job growth slowed sharply in May, feeding expectations of lower U.S. interest rates in 2019.
The pan-European STOXX 600 gained 0.9%, with Paris-traded stocks posting a 1.6% gain. Frankfurt-listed shares rose 0.8%, while their peers in London firmed 1%.
The yen consolidates
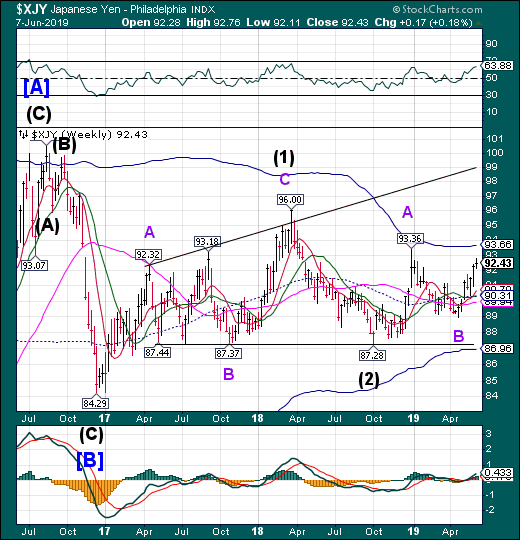
The yen consolidated its gains this week but may go lower in the next week for an anticipated Cycle low. The Cycles Model calls for a pullback at this point that may last up to two weeks. Instead of going to the Cycle Top, it may retest Short-term support at 90.70.
(Bloomberg) On the morning of Friday, May 31, when traders in Asia started their day with an unexpected move by President Donald Trump to impose tariffs on Mexico, there was one seemingly obvious course: Rush into the yen.
Buying Japanese currency when the rest of the world looks wobbly is a classic trade. Japan’s current-account surpluses and its holdings of everything from U.S. Treasuries to foreign real estate mean it doesn’t need to borrow from anybody. Investors, including those in Japan who have accumulated overseas assets, are confident about parking money in Japanese bank deposits or government bills when they want to ride out a storm. That, in turn, is good for the value of yen. And going into yen is an easy trade to make: Dollar-yen is the world’s second-most-traded currency pair, after euro-dollar, making it extremely liquid.
Nikkei rallies, leaving a new Head & Shoulders neckline
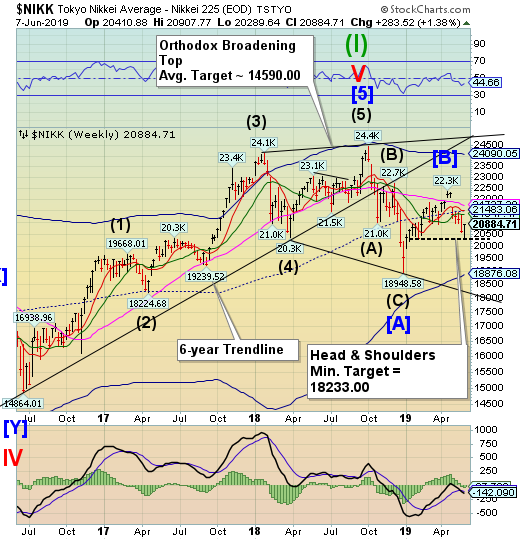
The Nikkei Index bounced at 20300.00, leaving a new Head & Shoulders in its wake. This did not negate the prior one, but simply extended the intended target. The “small bounce” mentioned last week retraced 33% of the decline from May 1.
(MarketRealist) The Nikkei 225 gained today after losing marginally yesterday. The index gained 0.53% today to end the day (and the week) at 20,844.71. During the week, the index gained 1.38%, advancing on two days and dropping on three. 2,404 stocks gained on the Tokyo Stock Exchange today, while 1,078 fell.
Economic data was disappointing
Today, Japan’s Statistics Bureau released consumption data for April. While the consumption expenditure rose 1.3% in real terms in April on a year-over-year basis, the same fell 1.4% over March’s. Analysts were expecting a 2.6% increase on a year-over-year basis and a -0.3% fall over March 2019. On a positive note, average cash earnings fell less than expected.
U.S. dollar makes a Cycle low

DX may have made a Master Cycle low today after declining to test Long-term support at 96.28. While Dollar weakness may continue for the next few days, it has established low where it may bounce for up to three weeks.
(YahooFinance) Speculators reduced their bullish bets on the U.S. dollar in the latest week to the smallest position since early April, according to calculations by Reuters and Commodity Futures Trading Commission data released on Friday. The value of the dollar’s net long position, derived from net positions of International Monetary Market speculators in the yen, euro, British pound, Swiss franc and Canadian and Australian dollars, was $33.32 billion in the week to June 4. That compares with a net long position of $34.61 billion the previous week.
The U.S. speculative community has been net long dollars since mid-July last year. In a wider measure of dollar positioning that includes net contracts on the New Zealand dollar, Mexican peso, Brazilian real and Russian ruble, the U.S. dollar posted a net short position valued at $30.97 billion, down from $31.33 billion, a week earlier. The CFTC data, which captures positioning through Tuesday, reflects the 0.9% fall in the dollar index over that period on increased expectations that the Federal Reserve will cut interest rates in 2019.
Gold makes a new 2019 high

Gold continued its bounce to a new 2019 high at 1352.70 today. The Cycles Model suggests only a few days left to complete this Cycle top. The indications are that Gold may join the SPX in its next decline.
(Reuters) – Gold prices jumped 1% on Friday to their highest levels since April 2018 as a sharp slowdown in U.S. jobs growth sent the dollar lower on growing expectations that the Federal Reserve would cut interest rates this year.
Gold also has benefited from concerns that U.S. trade wars with Mexico and China will slow the global economy. The precious metal is up more than 2.5% so far this week.
Spot gold was 0.4% higher at $1,339.97 per ounce at 2:34 p.m. EDT (1834 GMT), having earlier hit its intra-day high of $1,348.08.
U.S. gold futures settled up 0.3% at $1,346.10 an ounce.
Crude challenges the Broadening trendline

Crude challenged the Broadening Wedge trendline before closing above it. The bounce from this week’s low is not expected to last. The ensuing decline may last another 2 weeks. This may allow crude to decline to the Cycle Bottom at 41.79.
(OilPrice) OPEC is close to reaching an agreement to extend the production cut deal beyond its current expiry date at the end of June, Khalid al-Falih, the energy minister of OPEC’s largest producer and de facto leader, Saudi Arabia, said on Friday.
“On the OPEC side, a rollover is almost in the bag. The question is to calibrate with non-OPEC,” Reuters quoted al-Falih as saying at the St. Petersburg International Economic Forum in Russia today.
“I’m hoping it will be an easy decision and that we’ll roll over, but if it’s not, we will be flexible in terms of our position in the kingdom,” al-Falih said.
OPEC and its Russia-led non-OPEC allies are withholding a total of 1.2 million bpd of oil supply from the market until the end of June and are set to meet in coming weeks to discuss how to proceed with their oil supply management policies in place since the start of 2017.
Agriculture Prices pull back to Intermediate-term support

The Bloomberg Agricultural Subindex pulled back to test Intermediate-term support at 40.13. The rally may extend another week. The most likely outcome may be a high just short of mid-Cycle resistance a 46.06. A close above it may extend the rally another 2-3 weeks.
(SeekingAlpha) It’s not very often that Bloomberg, usually a level-headed financial news outlet, publishes an article that look like it belongs in Zerohedge. On June 1, Bloomberg came out with a very gloomy piece on the state of US agriculture that bills 2019 as the worst year for crop yields in modern history. Bloomberg isn’t the only one sounding alarmist these days on agriculture though. A headline article at the United Kingdom outlet The Guardian is also sounding rather doomish on the so-called “Aporkalypse” in China caused by African swine fever. This has so far resulted in the culling of 1.2 million pigs.
The Guardian quotes an animal epidemiologist, Dirk Pfeiffer of Hong Kong University, making a rather extreme statement: “This is the biggest animal disease outbreak we’ve ever had on the planet.”
Shanghai Index declines to a new low

The Shanghai Index appears to be restarting its decline after a month of consolidation. There is a gap to be filled at 2804.00 (February 22). Once filled, the decline may resume through the end of June.
(Bloomberg) China’s stock exchanges have stepped up scrutiny of listed companies to address corporate governance concern, amid a push to further open up the nation’s capital markets.
The Shanghai and Shenzhen stock exchanges sent out a total of at least 1,149 queries to listed companies in the first five months of this year, up 23% from the year-earlier period and 62% more than the 2017 tally, according to data compiled by Bloomberg. The questions mainly focused on irregularities in the firms’ financial results, inadequate information disclosure and relations with controlling shareholders.
The number of regulator queries on company disclosures have risen as the nation further opens up it’s capital markets to foreign investors, for whom corporate governance concerns have been a sore spot. Yi Huiman, chairman of China’s securities regulator, last month warned listed companies and managers not to release fake information or harm the interests of these firms. The moves precede the expected opening of the new board for technology companies.
The Banking Index bounces

— BKX bounced, making a 40%retracement of the decline after breaking through the Diamond formation. The Cycles Model suggests the trend is down for the next 4-5 weeks. This may be ample time to meet the Broadening Wedge target.
(BankingJournal) Farm banks remain in a strong position despite a recent uptick in farm loan delinquencies.
In the most recent Quarterly Banking Profile, the Federal Deposit Insurance Corporation noted asset quality deterioration at some farm banks (defined by the American Bankers Association as the 1,772 banks whose ratio of domestic farm loans to total domestic loans is greater than or equal to the industry average). The noncurrent rate for farm loans by farm banks—which include farmland real estate and agricultural production loans—increased 17 basis points during the quarter to 1.06%. However, with consistent increases in tier 1 and equity capital and a quality track record extending farm loans over the last decade, farm banks are well prepared to weather potential trouble on the horizon.
Farm banks remain healthy
Over the past decade, farm banks have enjoyed low delinquency rates relative to the broader industry. This has led to strong performance by farm banks, as described in ABA’s 2018 Farm Bank Performance Report. They have grown tier 1 and equity capital, expanded their loan portfolios and increased in asset size—all while enjoying relatively low volatility in asset quality. While noncurrent rates for farm loans increased this quarter, they are well below the average for the rest of the industry.