NFP
As usual on NFP Friday, it was all about jobs data. While the headlines surged, inflation hawks ruled the skies after a tepid 0.1% month over month average hourly earnings. The USD sold across the board; equity markets reacted well to the better headlines and weaker wage growth, and the S&P 500 closed up 0.7%. The Stoxx 600 gained 0.6%. Treasuries bounced higher, 10-year yields fell about 6bps, but those gains were substantially pared at the NY close.
The Australian dollar
The Australian dollar was all but greenlit, higher on the back of last week’s enormous trade number, but the AUD is still searching for the express elevator, as momentum struggles near critical resistance levels.
After touching just above 77 early APAC , in Friday’s London session trading, the Aussie was on its back foot after a surprise PBOC short-term lending facility (SLF) interest rate hike kicked in, which caused both iron ore and copper to collapse (more on that below).The AUD then rebounded after a softer U.S. average hourly earnings (AHE) release, which sent the USD tumbling across the board and dealers scrambling for top side exposure in the AUD. The weak wages all but all “binned” the U.S. March rate hike expectations and the Aussie carry appeal roared back to life.
However, dealers will be on guard for any new fallout from last week’s PBOC rate hike and eyes will be focused on commodity markets. Overall, high yielders will benefit from USD retracement and the unwinding of “President Trump trades”.
Last week’s sour CPI had all but been forgotten, as, despite the weaker print, the RBA will look past one-off more fragile inflation prints to maintain their neutral stance, as commodity prices are on fire.
Although the carry trade won the day post NFP, we should expect the tug of war between commodity prices and interest rate to remain the key drivers for the Aussie.
This morning Australia December adjusted retail sales come at -0.1% (expected +0.3%) . Also, Q4 retail sales excluding inflation, 0.9% QoQ expected 0.9% QoQ.
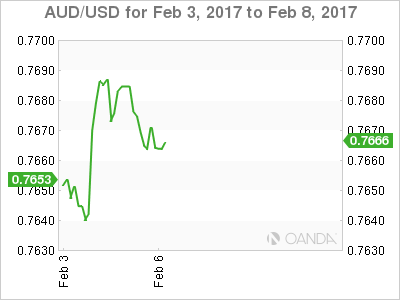
AUD/USD is slightly lower on the data and slips to 0.7660 level.
Japanese yen
The dollar-yen pressure cooker is running at full wattage, after weak wage growth; a data point that significantly influences the FOMC when deciding the course of the Fed Funds Rate.
Traders quickly sold USD, with bears showing moxie, looking poised to hammer the dollar mercilessly at the slightest opportunity. Dollar bulls, on the other hand, gave ground in the absence of fiscal policy measures. What initially started as a dollar correction in early 2017, is very much on the cusp of accelerating into a full-blown rout.
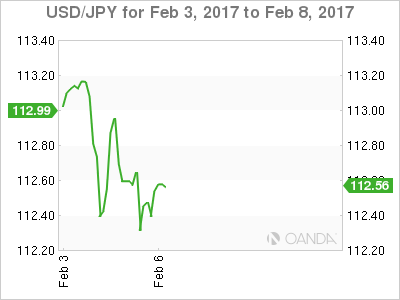
March rate hike hopes were dealt a severe blow on Friday. While ¥112.50 offers some initial support, expect the markets to probe lower in the absence of anything new on the U.S. economic policy front. The dollar cart all but toppled after last week’s Trump verbal intervention, dovish FOMC, and tepid wage growth. The dollar downside has been exposed, but dealers remain on edge as they are very leery dealing in politically charged markets while fear of the mighty dollar whipsaw remains intact.
The surprise BOJ, JGB operation on Friday may lend a supportive base around ¥112.00. The fallout extension from the weaker U.S. wage growth, coupled with re-acceleration of aversion for U.S. trade/immigration policies will continue pressure the pair, yet if this current BOJ operation successfully stabilises the market, traders will shift to rate differential correlations. In that scenario, the USD/JPY should move higher, but in the meantime, every currency trader every currency trader on the planet is watching the critical ¥112 level.
While our “go-to” correlations are wobbly, the recent choppy price action and the lack of any significant USD upward momentum clearly suggests that dollar bulls are jaded by the U.S. administration’s focus on trade and immigration policies, rather than fiscal stimulus and tax reform.
Weighing on Investors sentiment is increasing chatter about a possible shift in U.S. FX policy. However, such a change would require a Plaza Accord Revival. Given what we have seen from the early days of Donald Trump’s presidency, my guess is that if he is driven enough to take action on the currency front, we could see investors price in a greater possibility of a Plaza II.
President Trump’s lack of diplomatic filter will keep Forex traders on a razor’s edge and on headline alert, especially given the lack of U.S. economic data on the diary this week. Recently, the USD has traded from a weak position as there are few U.S. economic releases, which tend to underpin the greenback.
Emerging Markets APAC
The USD dollar continues to trade defensively regionally. USD ASIA has retraced more than 50 % of its election losses primarily supported by a return of portfolio inflows this year, and in general, the EM space has looked backed in early February. Indeed late 2016 doom and gloom outlook has brightened considerably as a broader USD trades on a softer tone. The $ 7 billion that flowed into the region in January is a very encouraging sign.
Lacking any active US fiscal policy agenda and tepid US wages, we should expect regional EM FX to remain well-supported this week
Chinese yuan
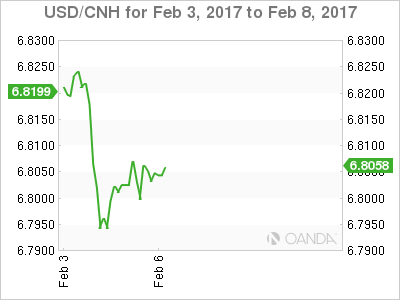
The broader USD weakness has taken pressure off the PBOC on the yuan front, but the mainland continues to be very much in focus. The PBOC raised their short-term lending facility (SLF) in an attempt to deleverage and derail a runaway asset freight train created by the unbridled use of credit.
However, PBOC watchers are now wondering if the central bank will use the SLF to manage currency policy?
Without question, the SFL move was a tentative move, given benchmark adjustments are usually flagged in .25 lb increments. The modest rate hike indicates the PBOC are cognisant about tightening for financial stability causes but are tentative to tighten so as not to burst the bubble or shutter growth prospects. I view this as only the beginning of a continuous tightening phase, designed to deleverage and I believe that the SLF will be gradually introduced as a foreign exchange policy tool.
Expect investors to scrutinise these developments carefully and to be on alert for additional policy responses from the PBOC.
The prospect of a U.S. March rate hike is evaporating, so expect the PBOC’s free ride to continue on the exchange policy front. Now that pressure is off on the currency front, will there be any shift in the restrictive capital controls policy? I suspect not, as, despite the recent corrective actions in the USD, most investors see higher U.S. interest rates and a stronger USD to emerge over the course of 2017.
On the data front, China Caixin manufacturing PMI remains in the expansion zone, rising to 51.0 versus 51.8 expected, but is playing second fiddle to the PBOC’s actions.
Without question, the SFL move was a tentative one given benchmark adjustments are usually flagged in .25 lb increments, but the modest rate hike indicates the PBoC are cognisant about tightening for financial stability causes but are tentative to tighten so as not to burst the bubble or shutter growth prospects. I view this is only the beginning of a gradual tightening phase, designed to deleverage and SLF will be gradually introduced as foreign exchange policy tool
Malaysian Ringgit
Foreign investors remain nervous about reengaging in the MYR markets after regulatory changes were submitted by BNM the last year. An overriding concern is one of liquidity, as without a robust currency hedging framework investors are shying away from Ringgit exposure, favouring other not so heavily regulated regional currencies. Conviction remains small, while confusion is high in the Ringgit space. Until a robust onshore market develops, investor sentiment will continue to be low.
Near term, given the dovish overtones from last week’s FOMC, tepid U.S. Average Hourly Earnings and supportive energy prices, I expect the Ringgit to trade with a positive bias this week, but to play a secondary role to its ASEAN peers.
Commodity Markets
Metals Overview
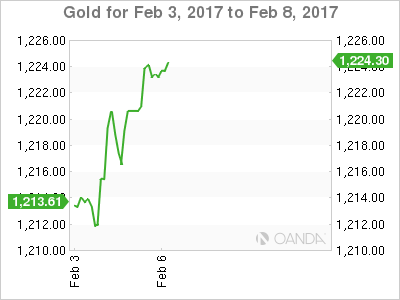
The gold market looks primed to extend its current upward momentum. Uncertainty about the Trump Presidency and concerns for U.S.-China trade policy, its impact on factories and jobs in China, as well as a weakening USD are collectively providing near-term support for, and making gold an attractive, safe haven for currency investors.
Copper
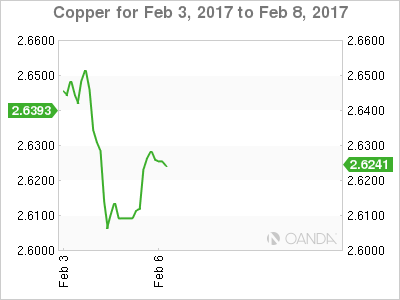
Record speculative long positions are vulnerable, and this week, markets remain very susceptible to even deeper corrections than what we saw on Friday. Perhaps more so, as supply-side disruptions are easing, as workers have restarted wage talks at the largest copper mines in Chile and China. Given that much of the copper, speculation is from China; the PBOC rate hike should deal a significant blow to those positions. Even more so if the market thinks that the PBOC will continue to squeeze speculators over the near term
Iron ore
Similarly, iron ore prices tumbled over 5% after the PBOC rate hike. There was a ripple of concern that the PBOC may tighten financial conditions, as the debt-fuelled stimulus sent alarm bells concerning potential bursting of asset bubbles, given the unbridled use of leverage set up by the PBOC.
Energy Sector Overview
Brent Oil
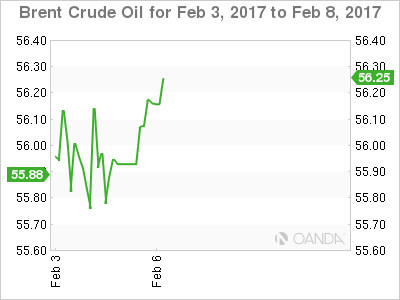
Brent oil is trading gingerly as increasing tensions between the U.S. and Iran simmer. Overall, however, arduously shallow trading ranges persist, as the markets see-saw between initial OPEC data, which indicate that recent production cuts are sticking, offset by the news that U.S. gasoline supplies continue to stockpile.
WTI
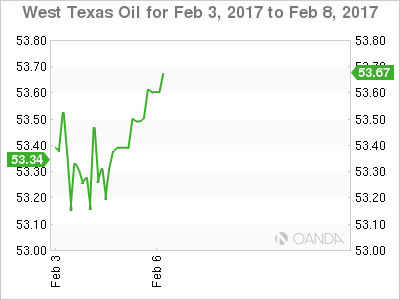
WTI closed the week with a whimper on small volumes, primarily driven by weekend position squaring. The geopolitical risk with Iran dominating headlines remains high as traders were less inclined to carry risk into the weekend. Overall top side WTI remains capped by the potential for U.S. shale rigs to come back online.
On the bullish side for oil, the greenback continues to wobble after the recent Trump verbal intervention, a less dovish Fed and a tepid print on average hourly earnings left the dollar bears in control.
Natural Gas
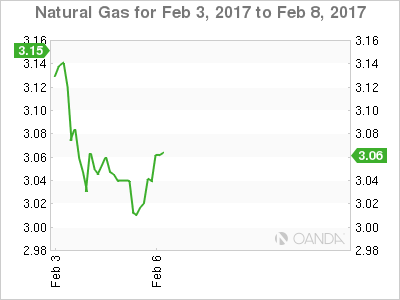
Prices fell sharply this week as the warm weather impact influenced sentiment. Keep in mind that 50% of U.S. households use natural gas, however positions run in oversold territory, thus are susceptible to changing weather patterns and larger than expected drawdowns on the inventory report.
.