
After a slight hesitation in yesterday's premarket, the S&P 500 hasn't much looked back since. And importantly, the credit markets – my biggest concern – had finally caught a bid. Their own reversal was less pronounced, making one question the corporate bond bulls' resolve right after the Powell and Mnuchin testimony, yet the bulls got their act increasingly together as the session drew to a close.
The markets gave me an answer as to both credit market ratios' dissonance, and also to the high yield corporate bonds to short-term Treasuries underperformance – yes, it's been fake weakness, just as in mid-May, and not a (temporary) bull trap setup.
This bullish price action with ducks getting increasingly in a row, happens against the backdrop of new high in US corona cases, Dr. Fauci getting more screen time and rising media fear-mongering. Yet stocks are acting tough – will they keep taking a lesson from the early April resilience?
S&P 500 in the Short-Run
I’ll start with the daily chart perspective (charts courtesy of http://stockcharts.com ):
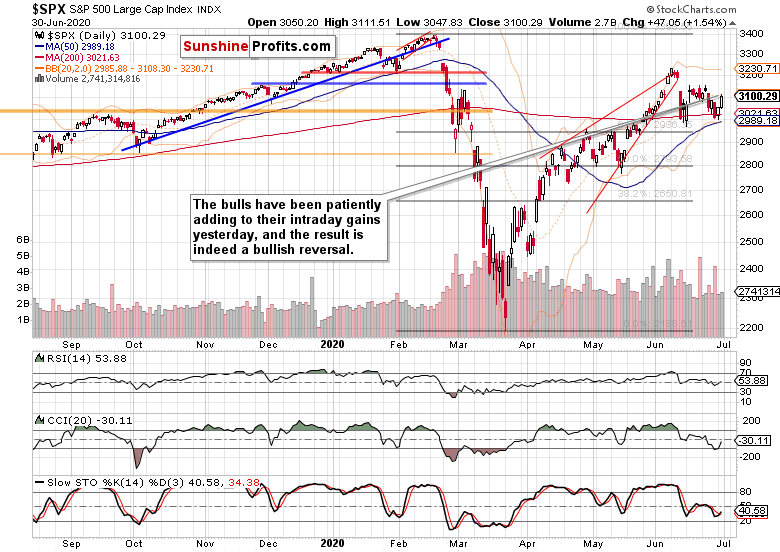
Things look pretty neat on the daily chart, don't they? But the key point was credibility of yesterday's upside move – and as the day progressed, the chips started falling increasingly more into the right places.
Today's analysis will be different, because I would love to highlight the many throughful opinions reaching me. They are countless, and I am deeply thankful for all of them. I'll quote three arriving during yesterday's U.S. session:
Price action of epicenter stocks which went up yesterday but being sold off partially this morning show hesitancy and cautiousness which shows investors are not yet convinced of the market which agrees with your view. One positive is (HYG) is rallying today. The chart seems to show 3 wave down correction is completed after 5 wave rally up. Now I am wondering if HYG is ready to charge ahead again. If so, I would think rest of the market may follow. If not, side ways to down market will continue I would think. Low put-call ratio still worries me, but record high short positions by large speculators is encouraging. Let's see who wins out in the end.
Such was my answer still before the testimony:
Yes, it's a question of whether we're looking at an up-leg in trading range, or a fledgling uptrend renewal. HYG volume is likely to be respectable today, so it's a question of the Powell testimony effect, and tomorrow's ADP non-farm employment change on the fundamental front (reaction to these). Indeed, it hinges on the ability of HYG to turn around, and more puts around would make the situation clearer, too. I also agree with the shifting perceptions of who the smart money is.
Fast forward to the testimony aftermath. We got wavering stocks and junk corporate bonds, but the downside move was relatively limited – and notably, signs from other markets started to form / confirm a coherent picture.
That's when the below comment came from a reader I hold in high esteem. See the great capture:
Bull/Bear ratio is at historic lows which is bullish. Price action across indices showing breakout out of a declining channel. Market internals are bullish. Based on RRG of SP sector, cyclicals are strong and defensive are weak - not what you expect from a weakening econ based on Covid-19 bear thesis. Still. Bullish
That's a valid point about the bull/bear ratio – but it's equally true that the bulls have been in very limited supply for quite a few weeks in a row already (less than 25% bullish). But the put/call ratios haven't spiked, which made me think that the bears aren't just yet putting the money where their mouth is. In other words, that the sentiment can get even more out of balance before moving away from such extreme readings.
Yes, I've not been drawing any declining lines or wedge-like structures that connect the June tops in either the S&P 500, the HYG ETF, or the HYG:SHY) ratio. On one hand, that's because I didn't get an improving volume on Monday signalling the S&P 500 getting ready to break out higher (and yesterday's wasn't totally stellar either – but hold on, that's just one piece of the puzzle to be outweighed by many others later on), and the HYG ETF was still acting weak on Monday.
But as I wrote in the article's opening, that proved to be a false sign of weakness, which was however still in danger of persisting after the Powell & Mnuchin testimony. Back then, it didn’t look like junk corporate bonds would want to break above their resistance. Convincing volume wasn't there, and neither was price action (unlike the price action in stocks). A part of the red flag was still there – would that be an opportune setup for the bulls who haven't yet bought into this reversal come?
After all, it's a matter of risk-reward ratio, and perhaps a pullback could come in the overnight session. But the entry to the final hour of yesterday's regular session gave me the answer that the momentum is about to get running the other way, and a pullback might not come.
Next, take market internals. Yes, market breadth has seen an improvement on Monday, and Friday formed a bullish daily divergence on the advance-decline line – but the advancing-declining volume didn't. Zooming out, the latter still looked coming off its early June highs – perhaps plateauing, but I didn't want to jump to that conclusion yet.
Then, in Monday's article, I also noted that we're seeing a rotation into growth plays, and that they're holding up better than defensive sectors such as utilities (XLU) or consumer staples (XLP).
The facts that tipped the scales for me, were improving post-testimony performance in the stealth bull market trio of energy (XLE), materials (XLB) and industrials (XLI). They were all pretty resilient in the face of the post-testimony S&P 500 downswing, which bodes well for their renewed ability to help pull the index higher.
One more note on the defensives – this time, it's about the ratios. Both the financials to utilities (XLF):XLU) and consumer discretionaries to staples (XLY):XLP) ticked higher – another helping hand from the sectoral heavyweights (financials, discretionaries) is more than welcome, and points indeed to cyclicals catching breath again.
Last but not least of the tipping-the-scale facts, comes the Russell 2000 (IWM). With its own upswing, it's approaching its mid-June highs, while the S&P 500 doesn't. That means we have two days in a row of strong outperformance – again looking at the mid-May parallel, this points to us having witnessed false weakness in IWM ETF that was still however unable to challenge its early June lows – that's a bullish divergence.
So, the market served me its answer to the yesterday's question below:
"(…) Are the bulls strong enough to make up for yesterday's suspiciously low volume? Should they be earnest about this reversal, they better step in fast – and at higher prices as well, so as not to make yesterday a bull leg in a sideways-to-down trading range."
That was quite a story the market tape has been telling us, wasn't it? Best of all, it's not apparent from one magic ticker, timeframe, or indicator – and is instead about the willingness and readiness to make the move when still faced with a less favorable array of signs than can be (and was) the case a few hours later on. Congrats to joining the bull party earlier, it has paid you not to wait for the increasing likelihood of my key concern (the credit markets) resolved positively – it has paid you off more than it did to me.
Let's quickly check some credit market charts next.
The Credit Markets’ Point of View

Here you go, that's the chance of a high yield corporate bonds (HYG ETF) close noticeably higher that I have been waiting for during much of yesterday's session before making the jump. It's here, and appears promising for the days to come.

Another fitting answer here. The investment grade corporate bonds to the longer-term Treasuries (LQD:IEI) ratio is leading the high yield corporate bonds to short-term Treasuries (HYG:SHY) higher.
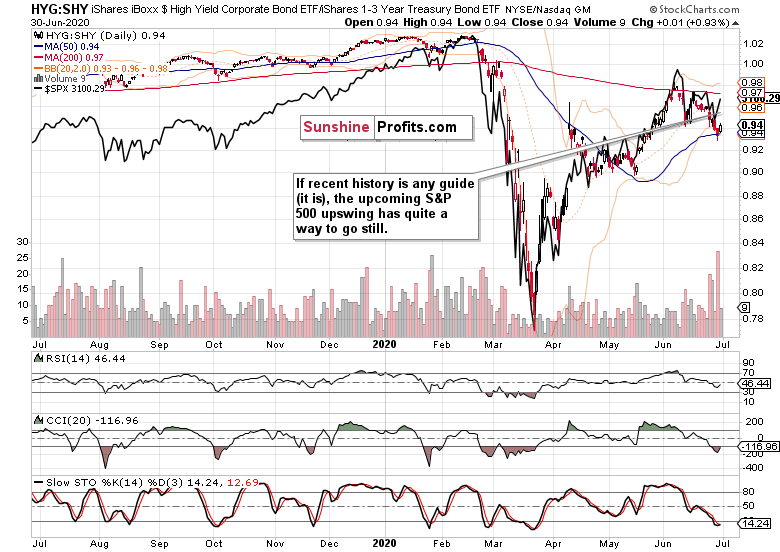
Both stocks and the HYG:SHY ratio are moving now in tune with each other, with solid chances of the upswing being extended today and later this week – and in the HYG ETF too. It indeed appears we're in for a replay of the May setup.
S&P 500 in the Short-Run
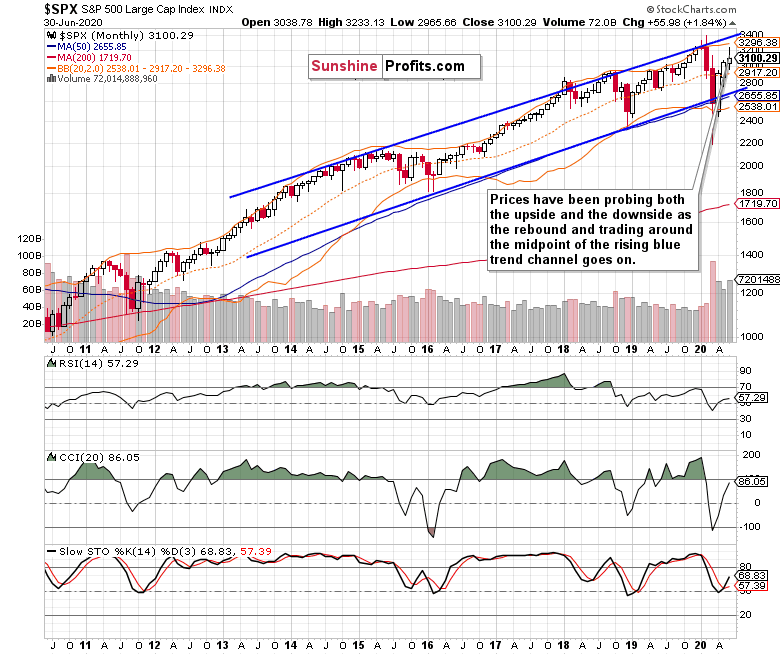
The monthly chart reveals that despite recent turbulences, the run higher is alive and well, not seeing signs of distribution. How many candles will it take for June's upper knot to be overcome?
Summary
Summing up, Monday's upswing got the powerful ally during yesterday's session, putting to rest the bearish signs not too hard to come by earlier. Crucially, the credit markets appear turning a page over recent prolonged high yield corporate bonds weakness, market breadth stands good chances of seeing more improvement soon, Russell 2000 and the stealth bull market trio are pointing higher. Best of all, the Fed didn't do much, corona scares haven't been acted on broadly, and the market appreciates the real economy recovery it's getting. Another lengthy consolidation post the rising May-June wedge appears over now, and stocks ready to explode higher again.