There just aren’t any bears left in the room, or at least they are not prepared to act in any meaningful way and this seems logical at this juncture, as swimming against the tide and going against this steamroller seems a low probability outcome. That said, one has to be concerned at just how much short-term goodwill is in the price and we can see a number of market sentiment indicators flashing red and at extremes.
The S&P 500 is pushing higher by another 20 basis points (bp) and while the year is only six trading sessions deep, we haven’t had a negative close so far in 2018. The rotation into US financials continues in earnest and the Financial Select Sector SPDR (NYSE:XLF) ETF (US financial sector ETF), which has been a trade I have been keen on for some time is gaining a further 0.9%, with strong inflows here ahead of JPMorgan Chase & Co (NYSE:JPM), PNC Financial Services Group Inc (NYSE:PNC) and Wells Fargo & Company (NYSE:WFC) reporting their quarterly earnings later this week. Of course, it’s not just about pre-positioning ahead of earnings, as the more dominant theme is one of a macro thematic and not specifically a bottom-up story, although owning Bank of America (NYSE:BAC) or Goldman Sachs (NYSE:GS) and taking a 2-3 year view still makes a lot of sense based on the fundamentals. That macro view is one of reflation and we have seen US Treasuries go on sale here, with the long-end of the curve taking a hit and having a few in the market asking whether this is genuinely the end of the 30-year bull run for fixed income.
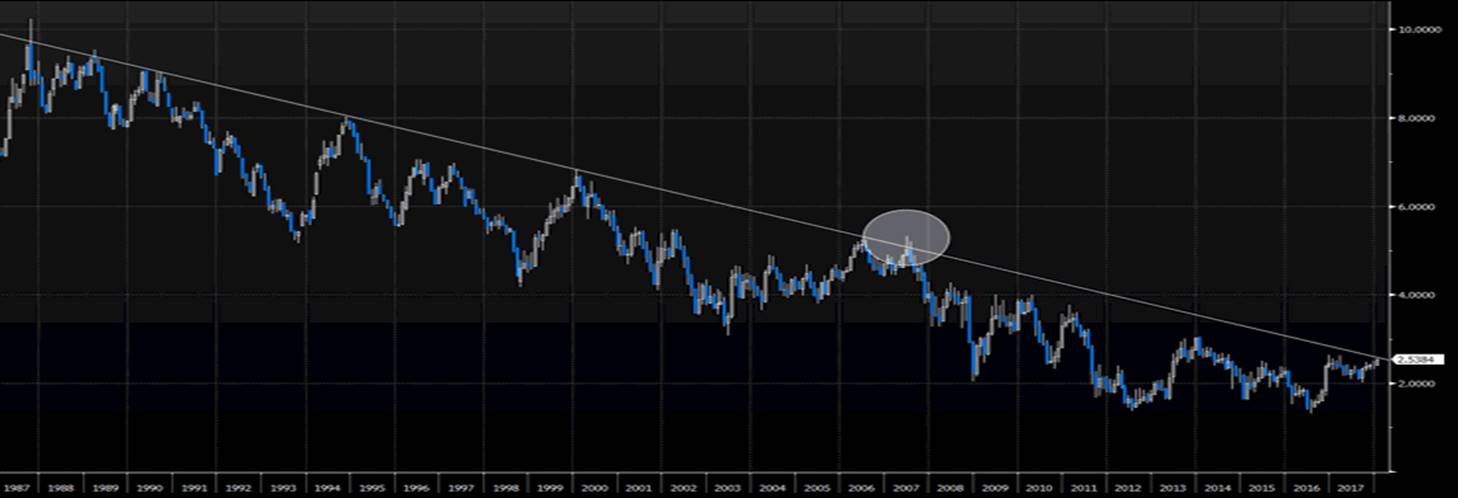
The 10-year US Treasury has pushed up 6bp to 2.54% and through supply at 2.50% and this puts the benchmark bond on a collision course for the December 2016 highs of 2.63%. The move in the back-end of the curve has naturally steepened the 2’s vs 10’s Treasury yield curve, and we can see the differential widening by the most since November 2016 and of course this only incentivises the buying of US banks. It will probably also enthuse the Federal Reserve, who as we know are watching the Treasury curve intently, as the recent curve flattening was a major considering as to why Fed member Neel Kashkari dissented against hiking the fed funds rate in the December meeting.
My own view on whether this is the end of the bull market is that there is still much work to be done and we really need to see the yield actually close the month of January above the longer-term downtrend at 2.63% to feel this has genuine legs. As we saw in 2007 (circled), the yield traded above the downtrend on a number of occasions but failed to actually close above the trend and the buyers had the last laugh.

Still, it hasn’t just been nominal bond yields that are moving higher, but inflation expectations have also moved up and this has kept ‘real’ (or inflation-adjusted yields) fairly steady, which is why tech stocks are failing to really respond and the FANG basket is largely unchanged. Inflation expectations, are on the rise in the US and this has to be monitored, with US 10-year ‘breakevens’ (or the difference between 10-year Treasury’s and 10-year TIPS or Treasury inflation-protected securities) up 2bp on the day and 2.04% are at the highest levels since March 2017.
I suggested in mid-November to play rising inflation expectations through the ETF market and to look at the INFU ETF (Lyxor US 10-year inflation expectations) and this working nicely and I continue to target the 105 level over the medium-term.
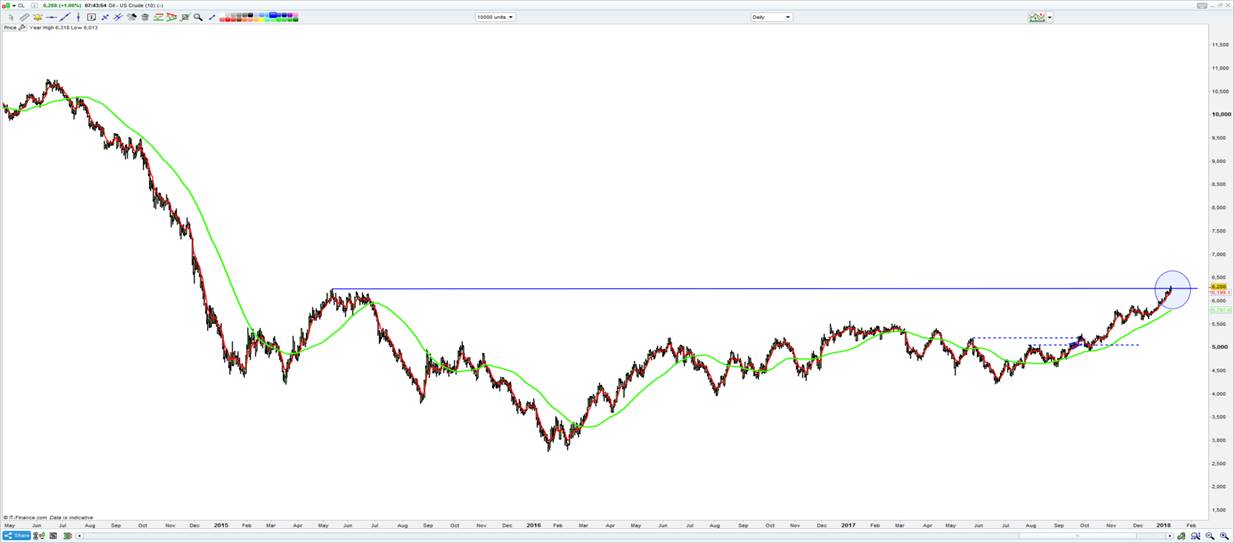
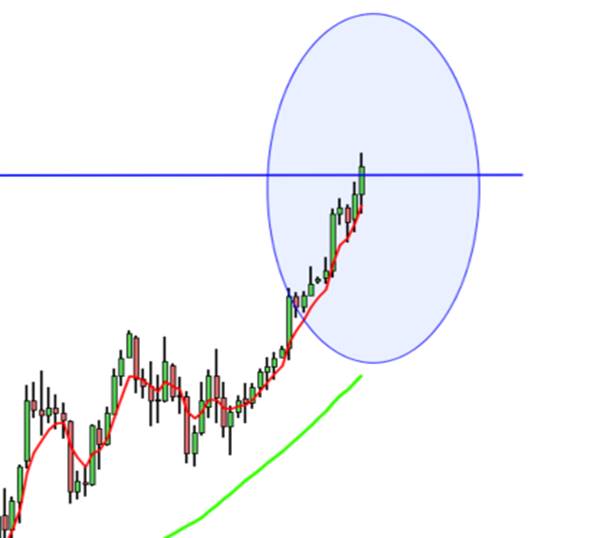
US data has hardly inspired with the NFIB small business optimism index coming in below expectations at 104.9 (vs expectation of 107.8), while the jobs opening report (or ‘JOLTS’) was also a touch under. Of course, the driver of overnight market dynamics is oil, although the irony of this situation is traders and investors are playing a 2% move higher in oil through buying the commodity itself, or through various side effects of higher oil, such as higher inflation expectations and financials. Energy stocks have actually taken a backseat, with the S&P 500 energy sector largely unchanged despite US crude breaking out to the highest levels since 2014, with price closing just shy of $63.
This takes the gains in US crude to around 50% since the June lows and the traffic has really been one-way and price is now 10% above the consensus estimates for Q4’18. On one hand, oil traders are getting quite excited about tonight’s DoE inventory report (due at 02:30 aedt), where the consensus is we see a 3.4 million barrel draw in crude stocks, yet a 3.03 million barrel build in gasoline inventories. At the same time, we have seen the EIA revise up its forecast for 2018 oil demand growth by 470,000 bpd. One suspects the systematic futures traders (or ‘CTA’s) would be all over this move higher too as their rules based style would be dictated by the strong underlying trend. Hard to be anything else but long crude here, although the elastic band is stretched and therefore price is vulnerable should inventories disappoint.


So US equities, and to an extent, European equities have inspired, as has credit, where high yield corporate credit continues to find buyers, despite the high yield index at the strongest levels since 2014. Aussie SPI futures have followed these moves in appreciation and we see the futures market sitting up 18 points at 6106 and so our opening call for the ASX 200 sits up at 6153. So a new high in the index should eventuate on open, although whether price can hold these levels is yet to be seen. That said, Aussie financials look set to open around 30bp to 40bp higher here and that will initially support.
BHP’s ADR suggests the miner opens 0.8% higher and the ASX materials sector, along with ASX energy, should build on the 3.5% YTD performance. That said, outside of crude we can see a 1% gain for spot iron ore to $78.47, but follow-through USD strength (the USD index has gained 0.2%) has weighed on copper and gold, while iron ore and steel futures (on the Dalian exchange) are modestly lower.
The event risk in the day ahead is mostly focused on China and this should later sentiment towards Aussie stocks to any great extent, with domestic November job vacancies not likely to get much focus. In China, we get December CPI (expected at 1.9%) and producer price inflation or PPI (4.8% eyed), although I would be more interested in moves in the yuan today given the PBoC have removed the “counter-cyclical adjustment factor” and the adjusted the methodology and the inputs by which the daily ‘fixing’ is calculated and in theory could lead to a short-term weakening of the CNY, which could keep the upside move in the USD on track. There seems little doubt that is this partly to appease the US, who are still deciding on trade sanctions against the Chinese.
