Market commentators tend to say “this is a big week for markets” and that usually heralds a potentially volatility inspiring event at the heart of the concern. However, this week really has it all and there is something for everyone.
We have central bank meetings from the Reserve Bank of Australia, the Federal Reserve and for FX traders one can also look at the Norges Bank. We have the Fed funds futures pricing at 64% chance of a June hike (from the Federal Reserve), but that pricing mechanism could also easily change given we have pretty much every key piece of US economic data being released. Here we see ISM manufacturing (tonight at midnight), core PCE, vehicle sales, services ISM and non-farm payrolls on Friday (consensus 190,000 jobs).
We also have the small affair of the French presidential elections on Sunday, and while many see this as a fait accompli, some are showing concern that Nicolas Dupont-Aignan, a first round candidate, has formally endorsed Marnie Le Pen and this may provide her with a few extra votes. The market doesn’t seem too concerned by this though and still see a fairly comfortable victory for Macron, with implied volatility still subdued and EUR/USD nicely supported into $1.0850.
The pricing around the June Fed meeting is interesting, as interest rate traders have largely overlooked the poor Q1 US GDP print on Friday at 0.7%. This seems a function of two key variables. Firstly, there is a strong belief that the fall in inventories (which explained 90 basis points of drag in Q1), and consumption, which fell heavily from 3.5% in Q4 to 0.3% in Q1, should both rebound nicely in Q2, setting the US Q2 GDP for a quarter above 3%. Secondly, the pricing around the Fed funds is taking inspiration from the S&P 500 and credit markets and as long as financial conditions remain as accommodative they are then the market will price a high prospect of monetary tightening.
US corporate earnings remain front and centre, especially with names like tech giants Apple (NASDAQ:AAPL) reporting this week. US earnings have absolutely nailed expectations, and this is keeping global equity indices supported amid an extremely cynical view on Trump’s tax policies. 57% of S&P 500 companies have reported Q1 earnings, with 80.7% beating on consensus earnings-per-share (EPS) and 64.8% on the sales line. We have seen an impressive 15.6% aggregate earnings growth (the consensus at the start of earnings was for 9-10% growth), with 21% EPS growth in NASDAQ-listed firms.
These earnings numbers keep the S&P 500 eyeing the key 2400 level and have also provided the ASX 200 with a flat open this morning, with our call at 5922. Traders and investors are keenly viewing whether the ASX 200 can break the recent high of 5950 and also if SPI futures can take out the March high of 5940. The answer to this will be set by the domestic banks, with corporate earnings of our own to focus on, with ANZ (AX:ANZ) reporting 1H 2017 earnings tomorrow and NAB (AX:NAB), MQG (AX:MQG) and WBC (AX:WBC) reporting in the days ahead. CBA will issue a trading update. So, with such a large percentage of the ASX 200 market cap reporting this week the index see a reasonable move, naturally depending on the earnings and the outlooks.
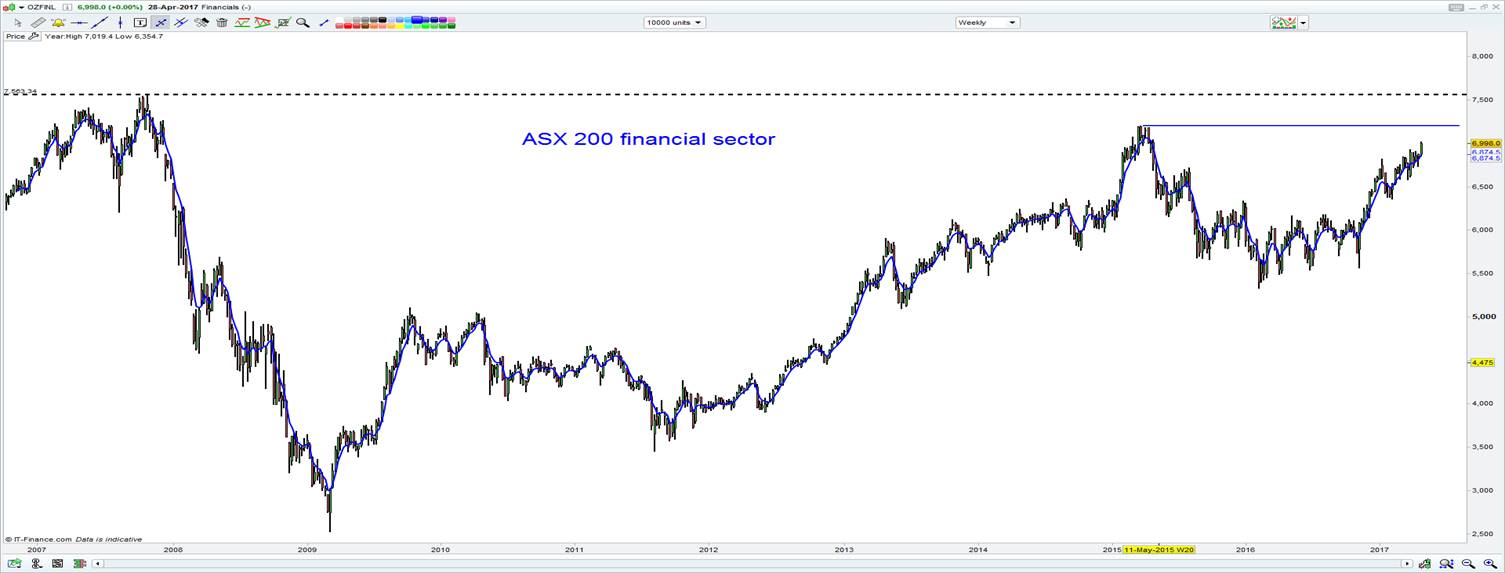
The ASX 200 financial sub-sector needs to hold and build on its break of 7000 and from here make an assault on the 2015 highs which is a mere 2.8% away. Interestingly, the all-time high (from 2007) sits 7.8% away, which seems far more attainable than the broader ASX 200, which needs to appreciate 15.6% to print a new all-time high.

The idea of “sell in May and go away” is certainly being talked about, but let’s not forget last May the ASX 200 gained 2.4% and despite the average loss over the past decade being 1.6%, most of that can be explained by poor monthly performances in the years between 2010 and 2013. June is actually a far worse month historically to be holding ASX 200 exposure, falling 2.2% on average.
In fact, it’s actually the AUD/USD that has struggled most in May, falling on average 2.2% in the month and that could well be worth be watching (not that anyone should ever trade on this theme in isolation, if at all).
Interestingly, AUD has opened the Asian session today on the back foot, with a few sellers being seen here and perhaps that is a reflection of the weekend China PMI data and non-manufacturing data, which printed 51.2 and 54.0 respectively. Both represented a slower pace of growth from the March print and this certainly throws weight to the view that economic activity in China has peaked and likely to contribute to GDP heading toward “around 6.5%” by year-end.
Look for a mixed open in the ASX materials sector today with US crude closing +0.7% on Friday, spot iron ore +3.6%, with iron ore futures also gaining 2.2%. Base metals have seen some life, with nickel putting on 1.2%. BHP’s American Depository Receipt closed unchanged.
