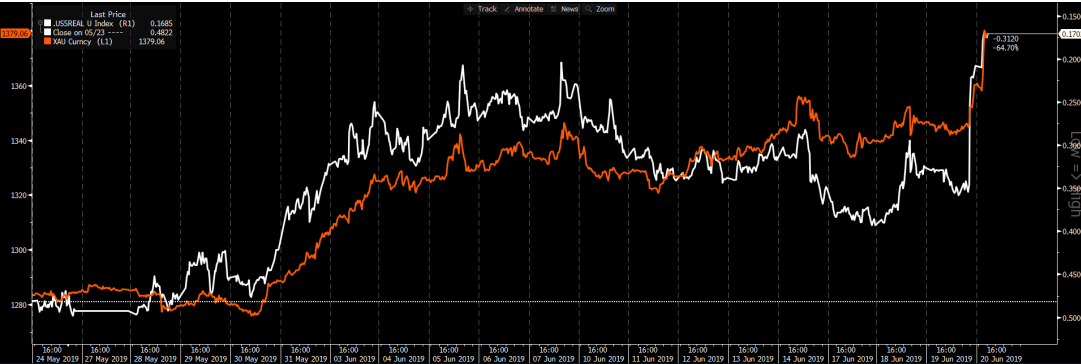
If Mario Draghi brought out the big guns at this week’s ECB meeting, then the reaction to the FOMC meeting confirms that the market was not disappointed by all they heard after the statement was released.
The ‘dots plot’, or its fed fund projections on where each Fed member sees the fed funds rate by a set date have been a market mover when so many had said they were redundant. With seven Fed members now forecasting a 50bp cut this year, a movement has started. Powell even went one further, detailing that those members whose ‘dot’ call was unchanged for this year, felt “added accommodation may be necessary.” They just need a bit more convincing.
The removal of “patient” was mostly in the price, where we see new guidance, where ``in light of these uncertainties and muted inflation pressures, the committee will closely monitor the implications of incoming information for the economic outlook and will act as appropriate to sustain the expansion.”
Another highlight of Powell’s speech was the line, “in a world where you are closer to the zero-lower bound. It is wise to react to prevent a weakening from turning into a prolonged weakening. An ounce of prevention is worth a pound of cure.” Aside from the theatrics in his choice of words (my emphasis), it gives us a belief that when they ease, they could try and get ahead of the curve, and this appeals to the magnitude of easing.
Triggers for a 50bp cut
The reaction in rates markets couldn’t be any clearer, and now we see a 100% probability of a cut at the July meeting and over 100bp (four cuts) over 12-months. The question of a 50bp cut in July has come up, and I guess that will be determined by the outcome of the G20 meeting later this month. But we have to consider the data too, and between now and 31 July, we look for core PCE (28 June), ISM manufacturing (2 July) and nonfarm payrolls (5 July) as our guide. Specifically, if U.S. nonfarms come anywhere near the numbers, we saw in May then 50bp in a thing. In the market’s eyes, it’s on, it’s a race to the bottom, and this notion of currency wars is kicking fully into gear, and it feels like this week is genuinely significant, with powerful insight to what could lie ahead.
While we’ve seen Asian equity indices finding buyers, it’s the flow in our ASX 200 index that has been noticeable. Interestingly, the ASX 200 is just 2.8% from a test of the 1 November 2007 all-time high. Valuations are punchy here, and the forward price-to-book is at an all-time high, with the 12-month price-to-earnings ratio at 16.22x - the highest since December 2017. I am not sure valuations matter too much when we look at subdued realized and implied volatility and Aussie bonds yields, which are negative if we adjust for inflation expectations and the ‘real’ return. The market will generally be interested to pay up for those earnings in this dynamic, especially as the current earning yield in the index is now some 427bp (or 4.27ppt) above what Aussie 10-year bonds yield.
And, it’s the moves in bonds that have reverberated, they are in beast mode right now. We can see when U.S. 2-year Treasury’s smashed through 1.80% it just heightened the need to buy more, and the 50-week average at 1.59% beckons. U.S. 10s have sailed through 2% through today, trading a further 5bp on the day to 1.97%, and while there is just so much love for bonds, this is a juggernaut that few sellers are going to get in the way of. If we adjust these bonds for inflation expectations and look at 5-y and 10-year Treasury’s on a ‘real’ basis, then at 17bp and 28bp, they are not too far from turning negative. In Aussie fixed income markets, we see the inflation-adjusted yields in Aussie 10-year bonds now -9.9bp – a record low.
Gold is the best house on a progressively awful neighbourhood
If the loser from the moves in rates and bond yields is USDJPY, which we see at 0.3% lower at 107.73, the beneficiary of these moves in bond yields is gold, and our flow has lit up today. Mostly, we’ve seen two-way flow in USD-denominated gold (XAUUSD), but we have seen good buying of AUD-denominated gold (XAUAUD), which has smashed through A$2000 and into new highs. The FX translation effect isn’t a huge issue at this point, as gold is rallying in every G10 currency, including NZD, which is the best-performing currency today after a slight hotter-than-forecast Q1 GDP (2.5%). And, when gold is rallying in every currency you know it’s hot, as traders see gold as a currency in its own right and the best house in an ever-deteriorating neighbourhood. As long as real rates are headed lower, the pool of negative yielding bonds increases (currently $12.3t) then gold is only going one way.

