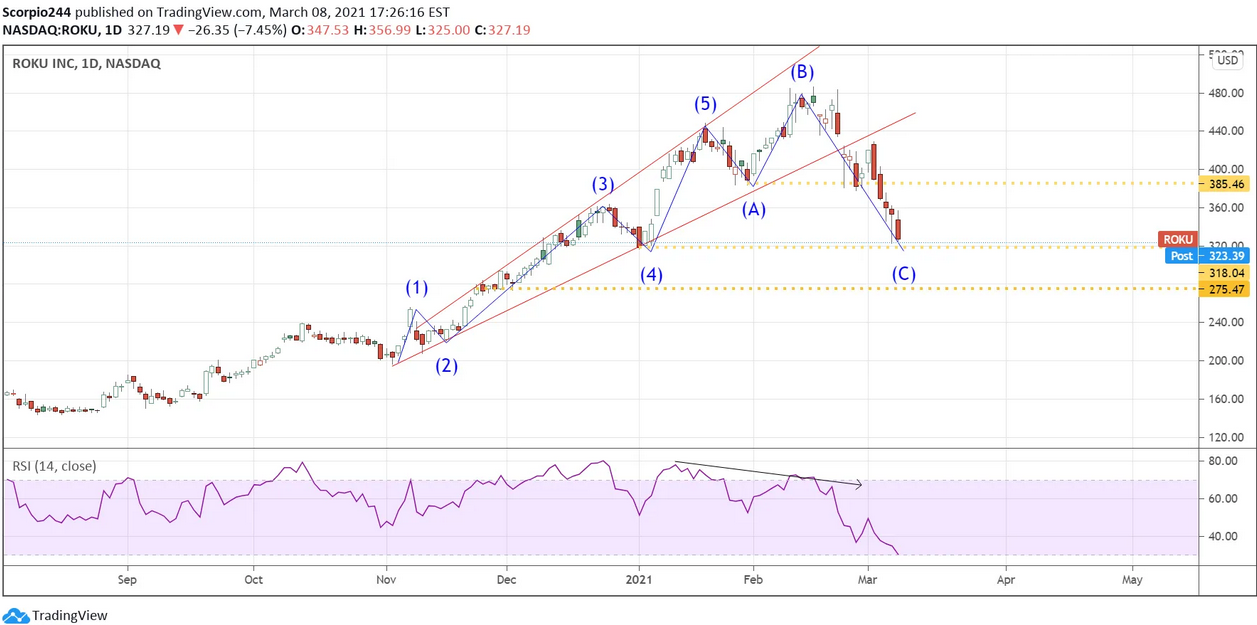
Yesterday was a rough day for stocks, especially technology stocks. They continue to get hammered as rates pushed higher. Now, the dollar is starting to strengthening as well, and that could further complicate the situation.
The 10-year TIP had a monster move yesterday, rising by almost 14 bps, to finish at -61 bps. The TIP still has a lot of ground to cover before making up for its lack of participation since the beginning of August. Since Aug. 1, the 10-year Treasury is up more than 100 bps, while the 10-year TIP is around 40.
Nasdaq (QQQ)
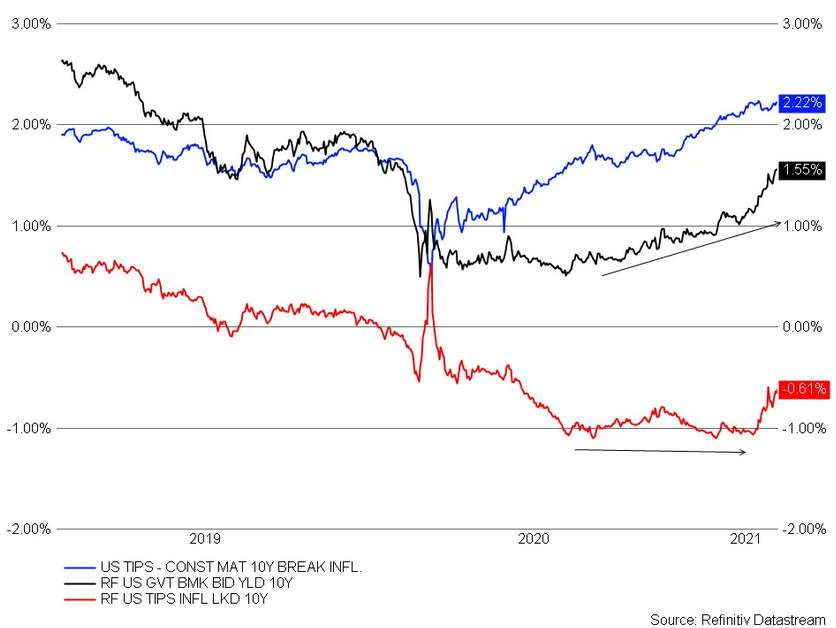
The NASDAQ, (via Q)s), gave back all of Friday’s gains and finished not far from Friday lows. The level at $297 is a significant support region. If that level of support snaps, I think there is a good chance the index will look to fill the gap around $274, about 8% lower, a total of 19% off the high.
S&P 500 (SPY)
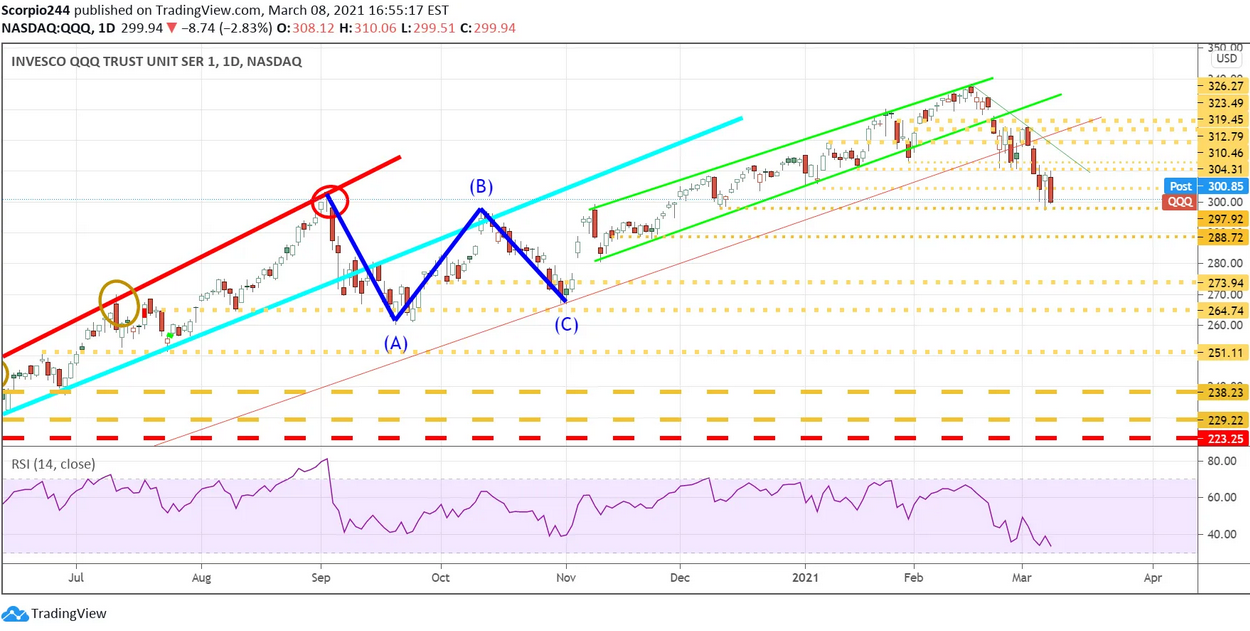
The S&P 500 (SPY) has escaped much of the damage because it is more diversified. But if the dollar starts to move higher, it will negatively impact industrials, energy, and materials. If those sectors go, it will be tough for the S&P 500 to maintain its current levels.
If I counted out this pattern correctly, which to this point has been working, then I think we will revisit Thursday’s lows around 3720, with an increased chance for a push to 3,650.
Dollar
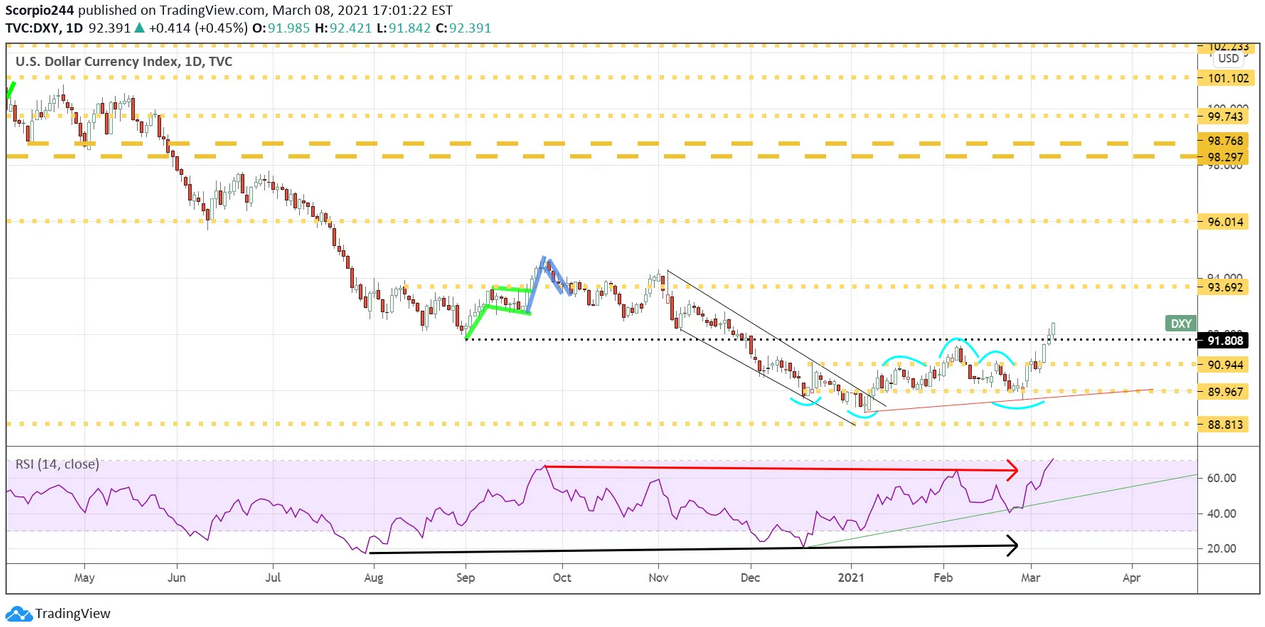
Again, a lot of this will be determined by what happens with the dollar, but given the huge move in yields, I don’t see how the dollar doesn’t push higher. The DXY has already broken out and is likely heading to around $93.70.
Energy ETF
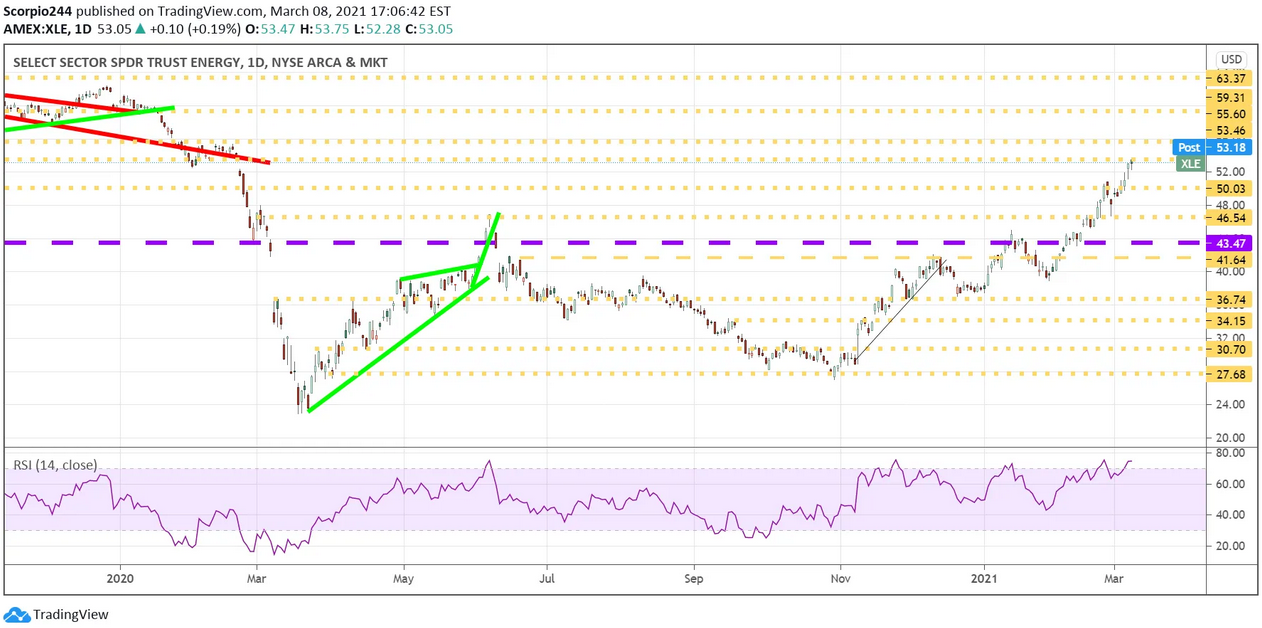
The Energy Select Sector SPDR® Fund (NYSE:XLE) has officially closed the gap from February of 2020. Typically, once a gap is filled, a stock or index returns to the previous trend. If that is the case, then we should expect to see the XLE trade lower.
Disney
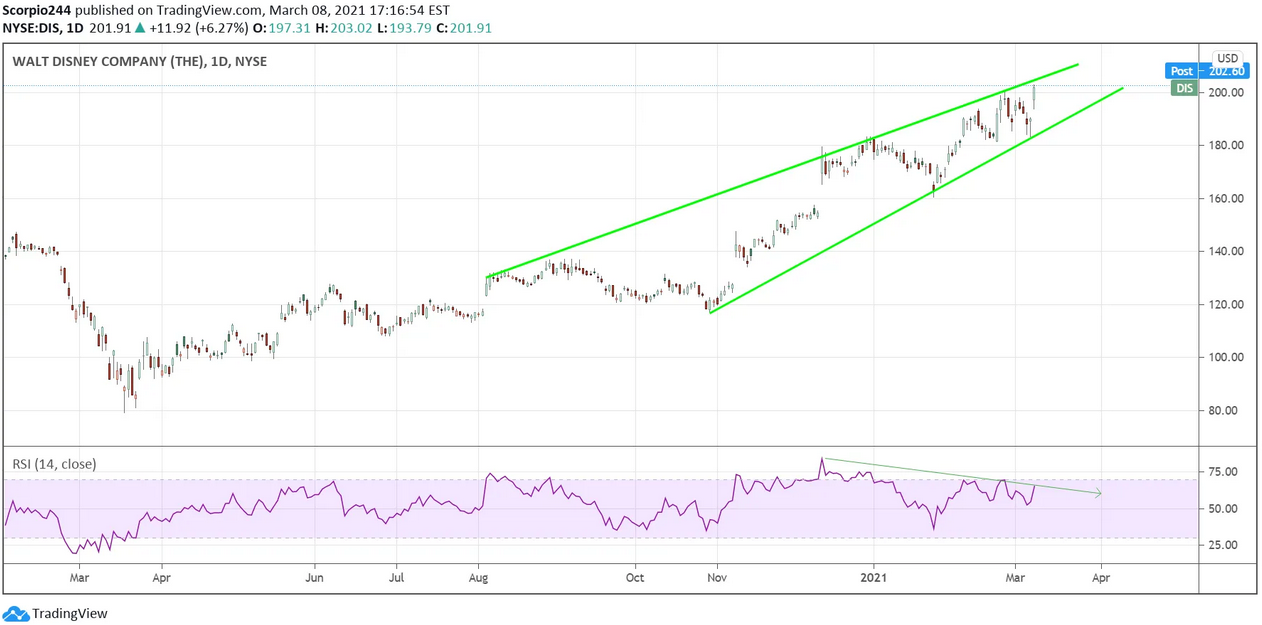
Disney (NYSE:DIS) had a monster move higher yesterday, but the stock appears to start to show a sign of a turn. The RSI for the stock has been trending lower, suggesting a loss of momentum in the stock, while the pattern appears forming appears to be a rising wedge.
Acadia
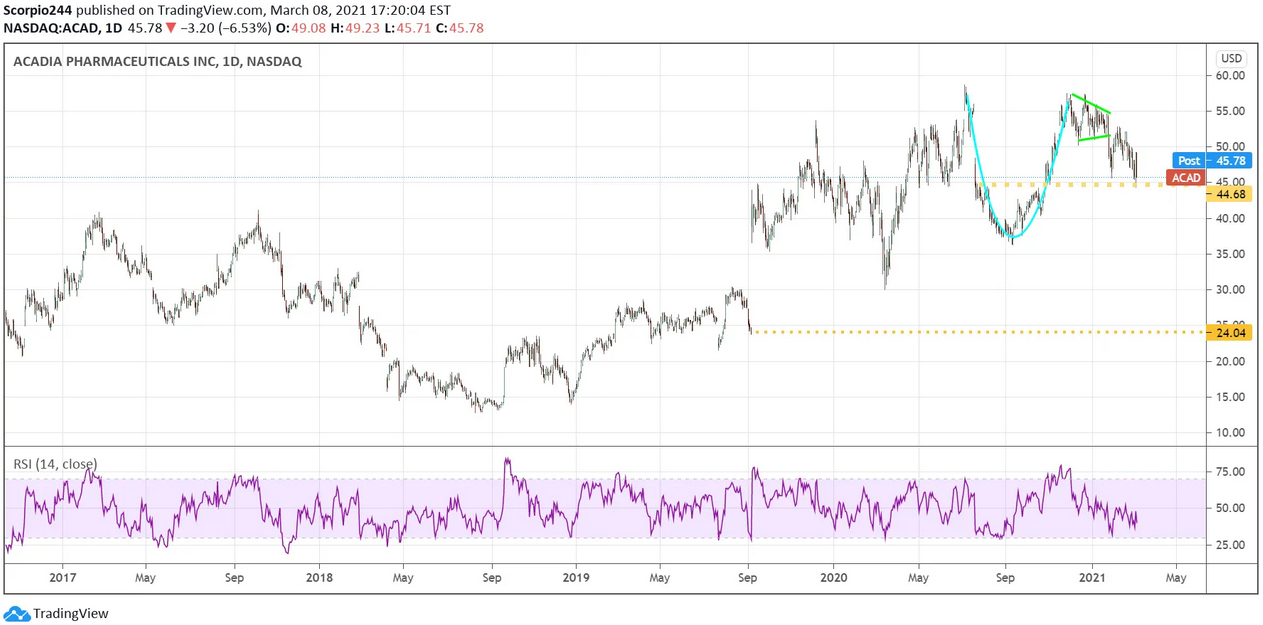
ACADIA Pharmaceuticals (NASDAQ:ACAD) had disappointing news last night regarding its application for Dementia-related psychosis. Just very strange, as analysts on the call seem just as baffled as to the company and as for me as well. I guess if all gaps get filled then the stock should find support at $24.
Nvidia
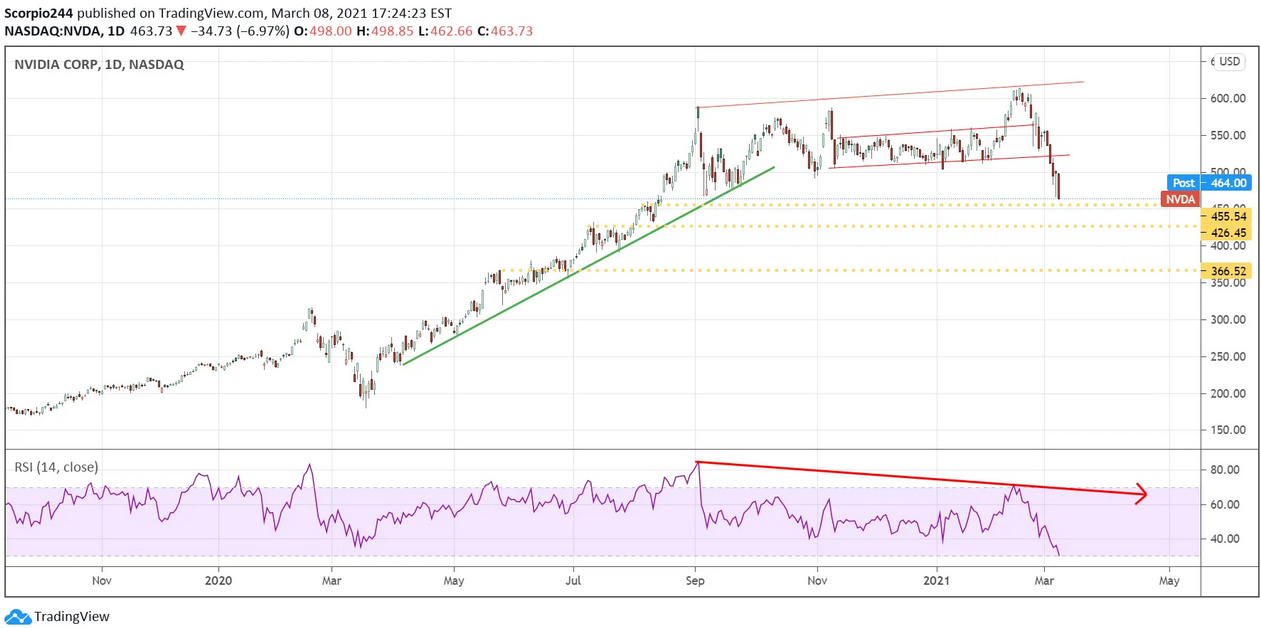
NVIDIA (NASDAQ:NVDA) sank yesterday by nearly 7%, closing around $465. The region around $455 to $460 is a pretty big support for the company, and the next level is $425.
Roku
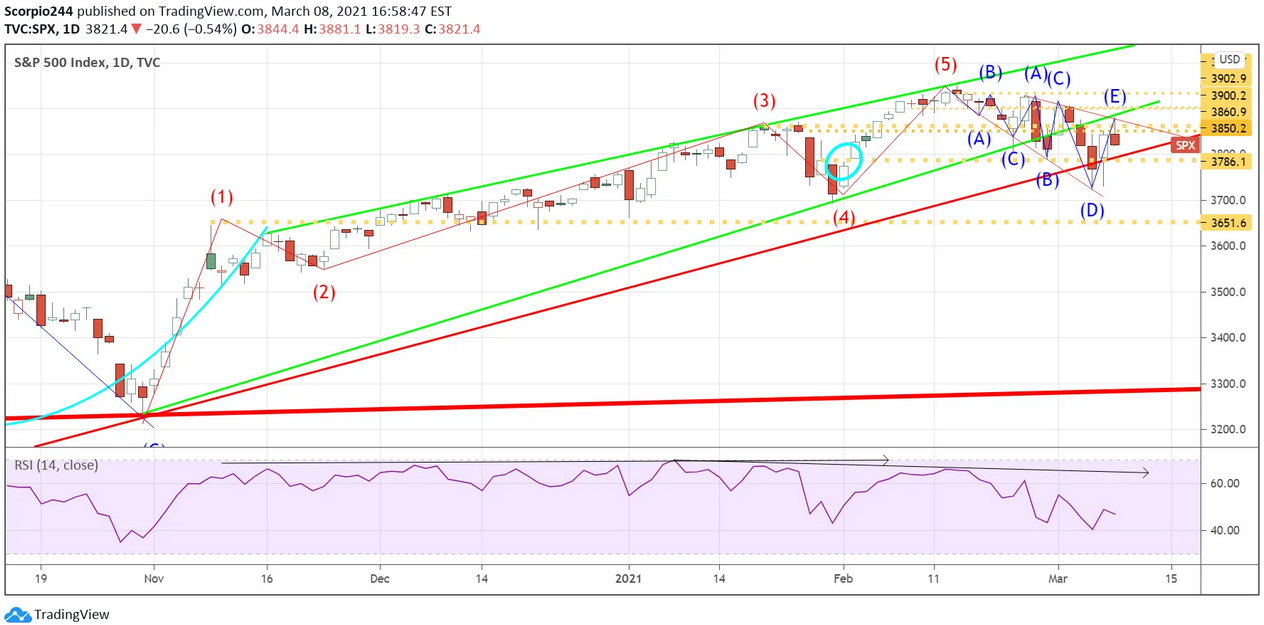
Roku Inc (NASDAQ:ROKU) also fell hard yesterday and is nearing support around $318. A break of support likely sets up a further drop to around $275.
