Macy’s Inc (NYSE:M), JC Penney Company Inc Holding (NYSE:JCP), Sears Holdings Corporation (NASDAQ:SHLD). Does anyone seriously believe that these corporations will thrive in the years ahead? They’re far more likely to go belly up than to turn things around.
Many investors seem unfazed by the probability that Amazon (NASDAQ:AMZN) will terminate traditional retail. They see it as an opportunity to invest more in the stock shares of the wildly overvalued e-tailer. What they’re neglecting, however, are the people that brick-n-mortar companies employ. There are roughly 400,000 at these three “dead-in-the-water” businesses alone.
It follows that I am not quick to dismiss the struggles of department stores, let alone disregard the decimation of mall shops like Foot Locker (NYSE:FL), apparel producers like Under Armour Inc A (NYSE:UAA) or sporting goods giants like Dick’s Sporting Goods Inc (NYSE:DKS). There is zero chance that millions of displaced employees across the retail landscape will find a ‘Prime’ job should Amazon be the sole survivor.
The S&P 500 SPDR Retail Trust (NYSE:XRT) is currently retesting lows set in January of 2016. At that time, the European Central Bank (ECB) and the Bank of Japan (BOJ) announced record levels of electronic money creation to bolster floundering financial markets. The Federal Reserve also played its part in the stimulus game by shifting from a 4-rate hike stance down to a single rate hike stance.
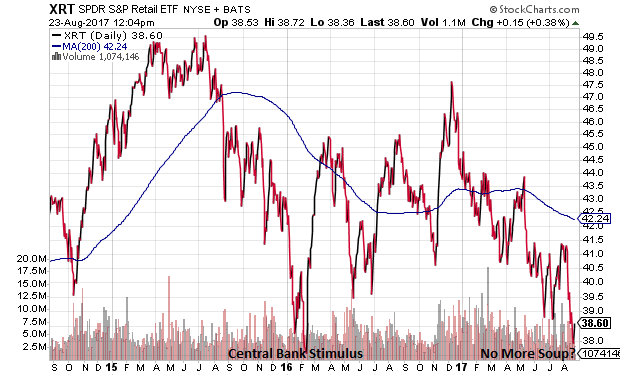
Here in August of 2017, however, global central banks are attempting to ween investors off of the monetary policy heroin. The Fed even expressed an intention to begin a process of reducing assets on its $4.5 trillion balance sheet.
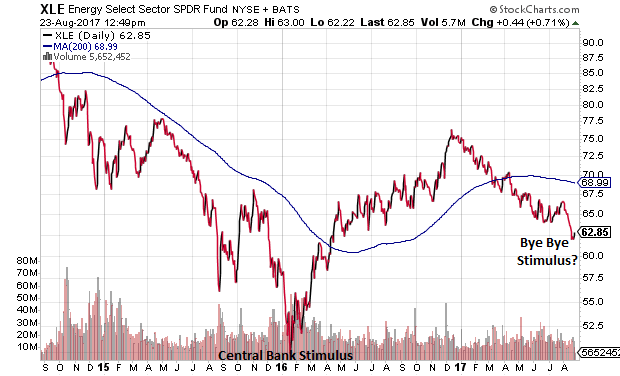
Unfortunately, old school retailers are not the only ones that may falter should the world’s central banks significantly tighten the reins on easy credit. Few sectors responded as brilliantly to global liquidity injections in January of 2016 as the energy sector. Now? The Energy Select Sector SPDR (NYSE:XLE) is back below its 200-day moving average as well as logging 52-week lows.
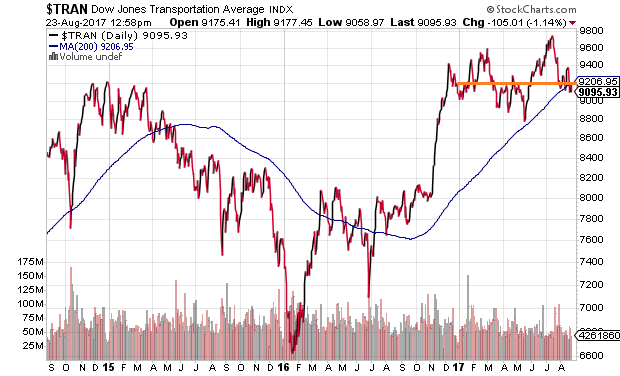
“Well,” you say. “It is only two segments of the economy. The others are still demonstrating remarkable strength.” Maybe not all of them. Consider the Dow Jones Transportation Average (DJT). It has corrected nearly 8% from its all-time July high. It has fallen below its key 200-day trendline. It has zero gains in 2017. And it has failed to build upon the post-election Trump rally.
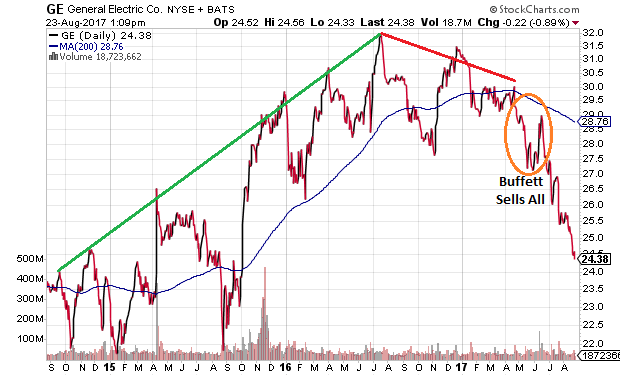
Then there’s one of the giant industrial bellwethers for the U.S. economy, General Electric (NYSE:GE). At least it used to be a titan of industry. Then came the news that Warren Buffett’s Berkshire Hathaway (NYSE:BRKa) dumped all of his 10.6 million shares in the 2nd quarter of this year. The folksy ‘buy-n-hold’ guru believed it was better to sell his entire stake – approximately $315 million at the time – rather than hold for the proverbial long-term. (Note: Buffett has also been divesting from International Business Machines (NYSE:IBM) as well as the beleaguered bank, Wells Fargo (NYSE:WFC).)
Granted, it is possible that GE is not the bellwether it once was. On the flip side, GE’s woes may be a sign that the economy is a lot weaker than Wall Street economists or the Fed want investors to believe.
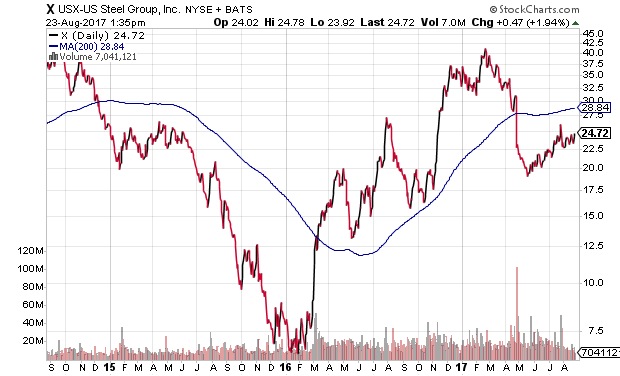
Remember, the Trump rally banked on meaningful tax reform as well as fiscal stimulus to replace monetary policy tightening. You can pretty much forget the latter. The likelihood of ‘bigly’ government infrastructure projects coming down the pike is slim. Just ask United States Steel Corporation (NYSE:X), which fell 50% between February in May of this year.
After Congress failed to repeal-n-replace existing health care legislation, after high-profile CEOs abandoned the president’s business advisory counsels, and after several top Republicans publicly stopped supporting the party leader, what is the basis for believing substantive tax reform will get done? Faith alone may be misplaced.
Sure, lower taxes can equate to higher stock prices when equity valuations are incorporating after-tax cash flows. On the flip side, the 20% post-election surge already reflects lofty tax cut expectations. If tax reform gets shot down or if it disappoints in size and scope, a sell-the-news scenario could see stock demand head for the exits.
Stocks do have a record level of liquidity injections by global central banks on a year-to-date basis and a record pace for those injections on a 12-month rolling return. In the first seven months? $1.7 trillion in global central bank intervention. Most of that liquidity found its way into riskier assets, and it is continuing to do so. Meanwhile, the liquidity is proceeding at its most rapid clip on a year-over-year basis as well.
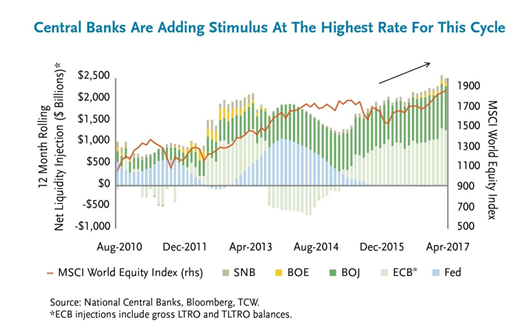
Yet right now in Jackson Hole, Wyoming, policymakers from the U.S. to the Eurozone, Asia to the United Kingdom, are debating when and how to restrain monetary stimulus. They’re not talking about how to prop up their respective economies even more.
The dilemma? Endless accommodation leaves no room for future efforts to buffer recessionary pressures and keeps a leveraged asset balloon bubbling at 1929 and 2000 valuation extremes. By the same token, rocking the financial market boat by tightening too quickly, or even discussing a tightening path that the markets perceive as dramatic, could result in massive price depreciation. In other words, there’s very little room on the monetary tightrope for Yellen and policy leaders to traverse.
Clearly, the S&P 500 is having little difficulty sitting near the top of its record perch. In fact, when the mainstream media practically loses its collective mind over the tiniest 2%-3% pullback, you have to wonder if they even understand what a normal 10% correction looks like. It hasn’t happened since the first few months of 2016.
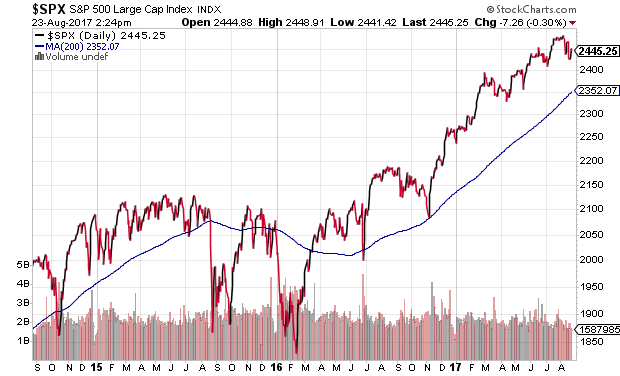
From my vantage point, we’re certainly due. There are only so many bricks in the ‘Wall of Worry’ that can accumulate – NAFTA, North Korea, debt limit stumble, analyst downward revisions to earnings, retail collapse, energy struggles, White House under fire, extreme stock valuation, tax reform uncertainty, central bank policy misstep – before nobody is climbing any higher. There won’t be enough ropes, ratchets, lockers, carbingers and quickdraws to go around for overly exposed investors.
Disclosure Statement: ETF Expert is a web log (“blog”) that makes the world of ETFs easier to understand. Gary Gordon, MS, CFP is the president of Pacific Park Financial, Inc., a Registered Investment Adviser with the SEC. Gary Gordon, Pacific Park Financial, Inc., and/or its clients may hold positions in the ETFs, mutual funds, and/or any investment asset mentioned above. The commentary does not constitute individualized investment advice. The opinions offered herein are not personalized recommendations to buy, sell or hold securities. At times, issuers of exchange-traded products compensate Pacific Park Financial, Inc. or its subsidiaries for advertising at the ETF Expert website. ETF Expert content is created independently of any advertising relationship.
