
The Stock Exchange is all about trading. Each week we do the following:
- Discuss an important issue for traders;
- highlight several technical trading methods, including current ideas;
- feature advice from top traders and writers; and,
- provide a few (minority) reactions from fundamental analysts.
We also have some fun. We welcome comments, links, and ideas to help us improve this resource for traders. If you have some ideas, please join in!
Review: What Is Your Typical time frame?
Our previous Stock Exchange asked the question: What is your typical time frame? We noted that market conditions change minute-by-minute, but human nature barely changes millennium-by-millennium. And then considered whether this could be your edge? We also noted that there are many different ways to think about time frame, and we highlights multiple viewpoints. We also considered the idea that the first hour of the trading day is often the best hour for most traders.
This Week: Is This The Calm Before The Storm?
As relatively strong market conditions continue, it seems the market continues to also climb a wall of worry. As a general observation, bull markets don’t come to an end because of time (it’s usually something more specific), and even though continuing strong conditions make many investors nervous, the stock market has not been rising as fast as earnings have been, and stocks still don’t look as expensive as they did in the recent past. As least that’s the notion put forth by this Montag blog post from yesterday:
While earnings growth has been strong this year, the market multiple has actually declined from 18.5x forward looking earnings at the beginning of the year to 16x currently (24.5x to 22x if looking on the trailing basis), implying multiple compression for the broad market.
Perhaps when zero nervous investors remain, that would in fact be a more prudent time to worry, but of course we don’t have a working crystal ball, and all we can do is be prepared.
And just because the market has been calm doesn’t mean you have to force any trades (for example, the the market “Fear Index” (i.e. the CBOE Volatility Index, aka “The VIX”) remains very low).

For instance, trading psychologist, Dr. Brett Steenbarger reminds us in this excellent article that being patient is actually a form of action.
You’ve no doubt noticed that many markets have slowed down with the summer trade, creating narrow daily ranges and little follow-through on directional moves. The word I most often encounter in trading journals is “patience”. In slower markets, there may only be occasional opportunities worth pursuing. That means that a good, disciplined trader is often not trading.
Further, as a cautionary reminder, the following article from Dr. Wealth provides a good example of how a trader can “blow up.”
As another interesting viewpoint, this article (from SMB Training Blog) suggests that as a trader you might consider skipping the rest of the day if you are ahead:
However, in our view, it’s important to always be ready because you never know when market conditions may change thereby creating attractive opportunities.
Model Performance:
Per reader feedback, we’re continuing to share the performance of our proprietary trading models, as shown in the following table (note: we added a year-to-date column this week):

We find that blending a trend-following / momentum model (Athena) with a mean reversion / dip-buying model (Holmes) provides two strategies, effective in their own right, that are not correlated with each other or with the overall market. By combining the two, we can get more diversity, lower risk, and a smoother string of returns.
For more information about our trading models (and their specific trading processes), click through at the bottom of this post for more information. Also, readers are invited to write to main at newarc dot com for our free, brief description of how we created the Stock Exchange models.
This week’s Stock Exchange is being edited by guest contributor, Blue Harbinger (Blue Harbinger is a source for independent investment ideas).
Expert Picks From The Models:
Holmes: This week, I purchased shares of Activision Blizzard (NASDAQ:ATVI) on Monday, 8/6. What do you think about that?
Blue Harbinger: Honestly Holmes, I am a fundamental long-term investor, and I always pay attention to short-term technicals when I am entering a new position (or adding to an existing one), so I always like to here what you have to say, considering you are a technical trading model. Why did you buy Activision Blizzard? Is it because you are a video-gamer when you’re not trading stocks?
Holmes: I bought because I am a dip-buyer, and as you can see in the following chart, there’s been a nice setup on ATVI. My typical holding period is around 6-weeks, and I exit when my price target is hit (or when my stop loss order hits–you know, risk management).

BH: I see the dip you are talking about, but what about the fundamentals? Are you even aware this company announced earnings last week, and they beat expectations. What about long-term forecasts? Do you have a viewpoint? Here is a look at the Fast Graph for ATVI, for you to consider.
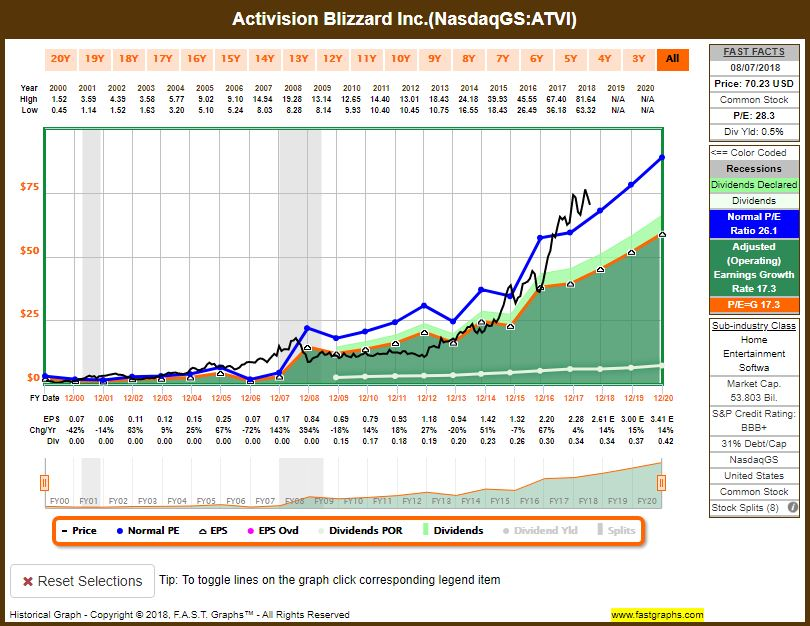
Holmes: I appreciate that information, and I am certainly aware of last weeks earnings numbers, but frankly I will be out of this position (hopefully at a nice profit) in a matter of weeks, therefore that long-term fundamental data is less important to me. This is my trading strategy, and it has been working well for me, and especially in conjunction with the other trading models, as shown in our earlier performance table.
BH: Suit yourself, Holmes. How about you Road Runner–any trades this week?
Road Runner: This week I sold my position in Burlington Stores Inc (NYSE:BURL) at $158. If you recall, I bought these shares back in on July 6th for around $150, so I am happy with the gain.

BH: Happy Road Runner? You’re a technical model, your supposed to be emotionless.
RR: True, sorry for confusing you, human. As you know, I like to buy stocks in the lower end of a rising channel, the setup on BURL was attractive, and here we are about 4-weeks later (my typical holding period), and I am “happy” to be taking profits.
BH: Hmm. I can’t imagine making a trade without at least considering the fundamentals. For example, this store has been caught up in the whole retail mess whereby the narrative makes people thing all brick and mortar is dying. Here as a look at the Fast Graph, for you to consider, Road Runner.

RR: Thanks, but totally not interested in your longer-term fundamentals. I have my technical trading process, and it works. Readers are welcome to contact Newarc, using the link at the end of this article, if they want more details on my process.
BH: Great- thanks Road Runner. And how about you, Felix–any trades this week?
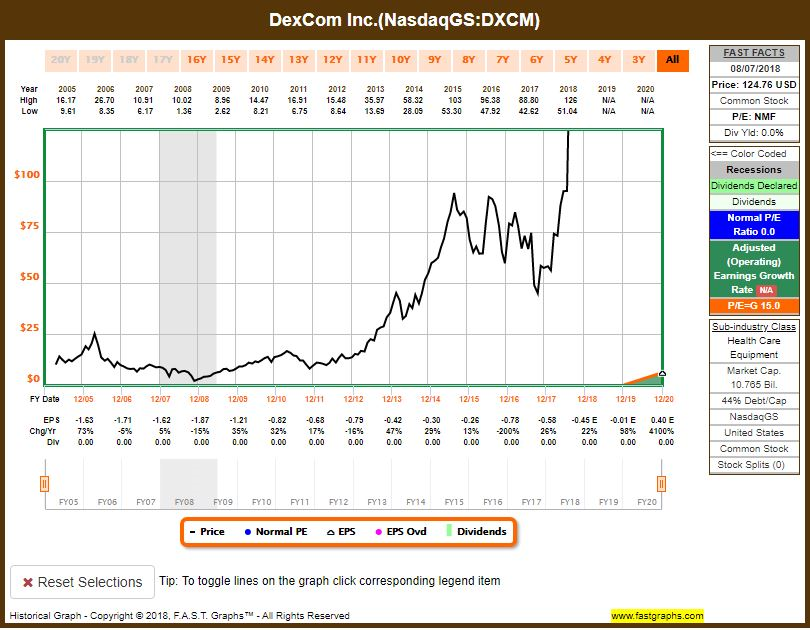
Felix: You bet. This week I bought DexCom Inc (NASDAQ:DXCM) on Monday. Ever heard of it?
BH: I know DXCM is a medical device company. They make blood sugar monitoring products for people with diabetes. Why do you like this stock, Felix?
Felix: Well, like some of our other trading models, I like momentum. However, I hold my positions for much longer than the other traders–66 weeks on average.

BH: Wait a second, your bought right AFTER this stock’s big 25% pop? That is a bold move. You must have a lot of confidence in this company. According to DXCM’s quarterly earnings release (released last week):
Q2 was a fantastic quarter for DexCom and demonstrates that CGM adoption is increasing significantly,” said Kevin Sayer, DexCom’s President and CEO. “This performance was particularly notable considering we only began launching our revolutionary G6 platform late in the quarter, and we are pleased to be able to raise our full year growth outlook.”
You must really like this story going forward. Here is a look at the Fast Graph.
Felix: Thanks for the color commentary, Blue Harbinger, but I am mostly sticking with my momentum data, it has been serving me well. By the way, I also ran all 30 of the stocks of the Dow Jones through my model this week, and the top 20 rankings are as follows:
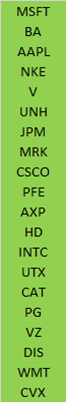
BH: You are quite the momentum trader, Felix, considering your top ranked stock, Microsoft (NASDAQ:MSFT) has already been performing very well lately. Remember when everyone in the media used to talk about how rich Bill Gates is?… Now it’s all Jeff Bezos (of Amazon (NASDAQ:AMZN)) this, and Jeff Bezos that.
Felix: Don’t be jealous, BH. And how about you, Athena–any trades this week?
Athena: This week I sold Applied Optoelectronics (NASDAQ:AAOI). I purchased on 6/11 for just over $42 and I sold this week for around $39.50. You can’t win them all.

BH: Nope- you cannot win them all. But based on your performance (as shown in the performance table earlier in this report) you are doing quite alright for yourself Athena–I won’t be shedding any tears for you. Here is a look at the Fast Graph, maybe you’d like to consider the fundamentals (in addition to your technicals) next time.
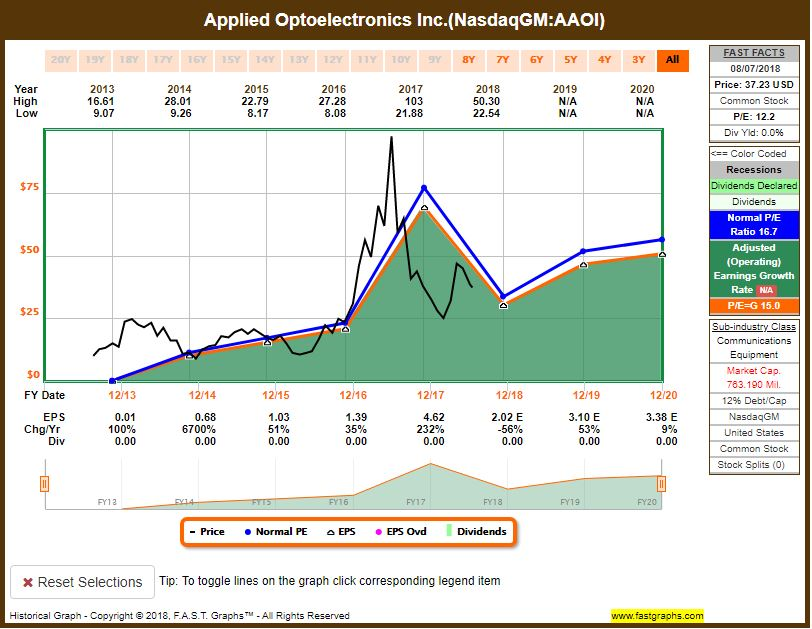
Athena: As you just noted, I am doing just fine (very well actually), so thanks, but no thanks for suggesting I use more fundamental analysis. I am sticking to my 17-week momentum process, which continues to be quite profitable.
Oscar: I agree with you, Athena. I’m not suggesting you bury your head in the sand, but why wouldn’t you stick with what has been working for you.
BH: Thanks for the words of wisdom, Oscar–but do you have any trades this week?
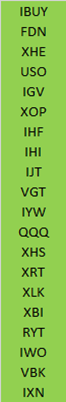
Oscar: This week I ran our “Comprehensive & Diverse ETFs Universe” through my model, and I have ranked the top 20 below. And as you know, I trade ETFs and sectors, I also follow a momentum strategy, I typically hold for about 6-weeks, and then I rotate into a new sector.
Conclusion:
You never know when opportunities or turmoil will arise in the market. Find the strategy that works for you, and stick with it. That doesn’t mean be complacent or stop learning. And it doesn’t mean never move outside your comfort zone either. Understand the risks and rewards, and ultimately cater your strategy to meet your own personal needs.
Background On The Stock Exchange:
Each week, Felix and Oscar host a poker game for some of their friends. Since they are all traders, they love to discuss their best current ideas before the game starts. They like to call this their “Stock Exchange.” (Check out Background on the Stock Exchange for more background). Their methods are excellent, as you know if you have been following the series. Since the time frames and risk profiles differ, so do the stock ideas. You get to be a fly on the wall from my report. I am usually the only human present and the only one using any fundamental analysis.
The result? Several expert ideas each week from traders, and a brief comment on the fundamentals from the human investor. The models are named to make it easy to remember their trading personalities.

Getting Updates:
Readers are welcome to suggest individual stocks and/or ETFs to be added to our model lists. We keep a running list of all securities our readers recommend, and we share the results within this weekly “Stock Exchange” series when feasible. Send your ideas to “etf at newarc dot com.” Also, we will share additional information about the models, including test data, with those interested in investing. Suggestions and comments about this weekly “Stock Exchange” report are welcome.