
The Stock Exchange is all about trading. Each week we do the following:
- Discuss an important issue for traders;
- highlight several technical trading methods, including current ideas;
- feature advice from top traders and writers; and,
- provide a few (minority) reactions from fundamental analysts.
We also have some fun. We welcome comments, links, and ideas to help us improve this resource for traders. If you have some ideas, please join in!
Review: How Does Earnings Season Impact Your Trades?
Our previous Stock Exchange asked the question: How Does Earnings Season Impact Your Trades? We acknowledged that many long-term investors ignore what they consider short-term “noise,” especially during earnings season. However, many traders identify opportunities during earnings season related to volatility, technicals, quantitative factors, and fundamental news, to name just a few. Building on this topic of short-term versus long-term, this week we ask the question…
This Week: What Is Your Typical Timeframe?
Market conditions are changing constantly, and as traders/investors, there are lots of different ways to think about timeframe. To kick things off, here is a great quote from Jim O’Shaughnessy (*hat tip to Howard Lindzon):

Lindzon’s article (link above) describes how new technologies make it practically frictionless to trade today (which was not the case when he was first starting trading), and that “tens of millions of new investors are being onboarded to the world of investing and trading over the last few years.” He also notes that:
Today everyone is learning by doing.
By doing you fail. By failing you learn.
And that he is “extremely bullish on this next generation of investors.” In perhaps an overly sinister interpretation of his article, it almost seems as if he is thinking of the old saying “there is a sucker born every minute,” and he is looking to profit from them. After all, if the markets change minute-by-minute, but human nature practically never does, then perhaps he’ll have an “edge” on this constant flow of “tens of millions” of new investors and traders.
Another way to think about investing timeframe is in terms of what time of day is best to trade? According to this article by Cory Mitchell
Trading during the first one to two hours that the stock market is open on any day is all many traders need. The first hour tends to be the most volatile, providing the most opportunity. Although it sounds harsh, professional traders know that a lot of “dumb money” is flowing at this time…
Dumb money is created by people making transactions based on what they read in the newspapers or saw on TV the night before.
Just this last Monday morning was perhaps a good example of what Corey was referring to when the price of big-dividend intermodal container company, Triton International Group Inc (NYSE:TRTN) moved dramatically higher in the first hour after a very bullish article about the company in Barron’s over the weekend.

Of course legendary investor, Warren Buffett, has his famous quote on investing timeframes:
If you aren’t willing to own a stock for 10 years, don’t even think about owning it for 10 minutes.
But take this Buffett quote with a grain of salt considering it’s a little harder for Buffett to quickly move in and out of positions with his billions and billions of dollars than it is for the average trader with a much smaller (and more highly liquid) account size (i.e there are more trading opportunities for the average Joe–those that don’t have many billions of dollars to trade).
And as a reminder, “trading” versus “investing” are considered by many to be very different concepts, in the sense that trading is usually shorter-term whereas investing is usually longer-term.
Blue Harbinger shared a timeframe related article this week about Omega Healthcare (NYSE:OHI) –a high yield REIT expected to announce earnings today. The article basically argues that there is a lot of risky short-term volatility, but the company’s long-term prospects could be quite different. Blue Harbinger is also the guest editor of this week’s Stock Exchange report.
For reference, the typical trading timeframe for our technical models ranges from weeks, to months (depending on which model), as described in the table near the end of this report.
Model Performance:
Per reader feedback, we’re continuing to share the performance of our proprietary trading models, as shown in the following table (note: we added a year-to-date column this week):

We find that blending a trend-following / momentum model (Athena) with a mean reversion / dip-buying model (Holmes) provides two strategies, effective in their own right, that are not correlated with each other or with the overall market. By combining the two, we can get more diversity, lower risk, and a smoother string of returns.
For more information about our trading models (and their specific trading processes), click through at the bottom of this post for more information. Also, readers are invited to write to main at newarc dot com for our free, brief description of how we created the Stock Exchange models.
Expert Picks From The Models:
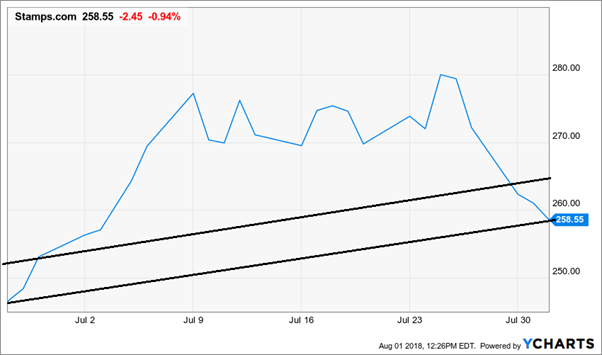
Road Runner: This week I bought shares of Stampscom Inc on Tuesday (7/31). Are you familiar with this company?

Blue Harbinger: Yes–the company delivers Internet-based mailing and shipping solutions. It basically enables small businesses, enterprises, and online retailers to print U.S. Postal Service-approved postage. It operates under a variety of names (e.g. Endicia, ShipStation, Auctane, ShipWorks, ShippingEasy, NetStamps, Internet Postage, PhotoStamps, PictureItPostage, Photo NetStamps and Stamps.com). What do you like about this company?
RR: As you know, I am a momentum trader, and I like to buy stocks when they are technically trading in the lower end of a rising channel. Here is the chart for Stamps.com.
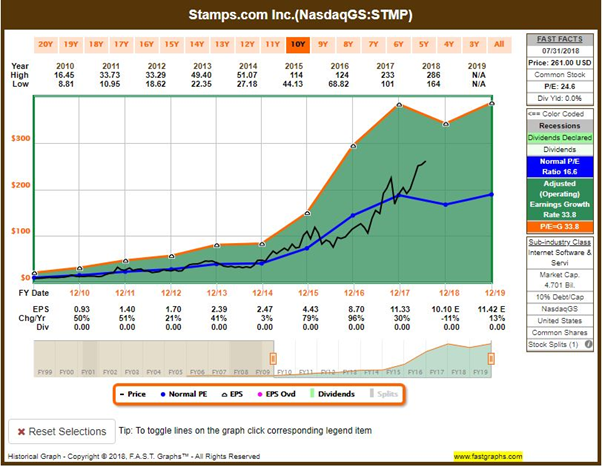
BH: I like this trade. And even though I know your typical holding period is 4-weeks, it looks like you’ve already made some money, considering Stamps.com announced very strong earnings Wednesday after the close, and the shares were up 8.4% on Thursday. Here is a look at the Fast Graph.
RR: Thanks for that information, it is great for fundamental investors, but as you know, I place my trades based on technicals.
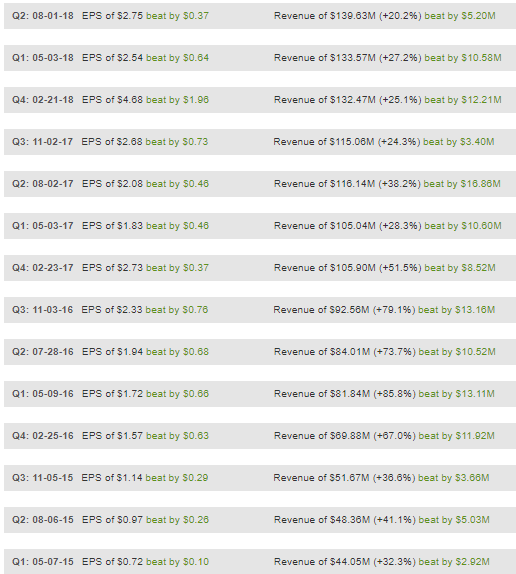
BH: I know you do. I also know you keep the specific technical metrics close to your chest, but I’m on to you. I suspect when you say you like momentum, earnings momentum is part of that. This company has strong momentum in exceeding earnings expectations, and they did it again just this week. Here is a look at the data.
RR: Interesting thought, however I am happy to share more information with anyone interested in learning more and perhaps trying it out.
BH: Thanks, Road Runner. How about you, Felix–anything to share this week?
Felix: I have some technical rankings (based on momentum) to share with the group this week. As you may recall, I look for uncrowded trades, and I typically hold for about 66-weeks, on average. This week I ran the Russell 100 (US Large Cap) through my model, and the top 20 rankings are included in the list below.
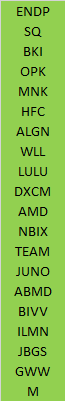
Blue Harbinger: I see Endo Pharmaceuticals (NASDAQ:ENDP) at the top of your list. You know Athena bought that stock two weeks ago, and she typically holds for about 17 weeks, so you’re in good company. Athena is also a momentum trader by the way. The stock is up significantly since Athena bought, but it has pulled back recently, which may be part of the reason you bought. Thanks for sharing.
Felix: You’re welcome. And how about you, Oscar–anything to share this week?
Oscar: This week I ran our High Liquidity ETFs (with price-volume multiples over 100 million per day) through my model, and the top 20 rankings are included below.
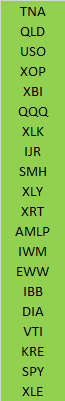
BH: I like to see both the Nasdaq 100 QQQ and the S&P 500 SPY on your list. Those are both broad indexes, and it makes me think things are looking good for the overall market, at least for the next 6-weeks–that’s your typical holding period, correct?
Oscar: That’s correct. As you know, I am a momentum trader. And my typically holding period is about 6-weeks (I usually exit by rotating into a new sector or ETF). I am seeing very good momentum in these names right now.
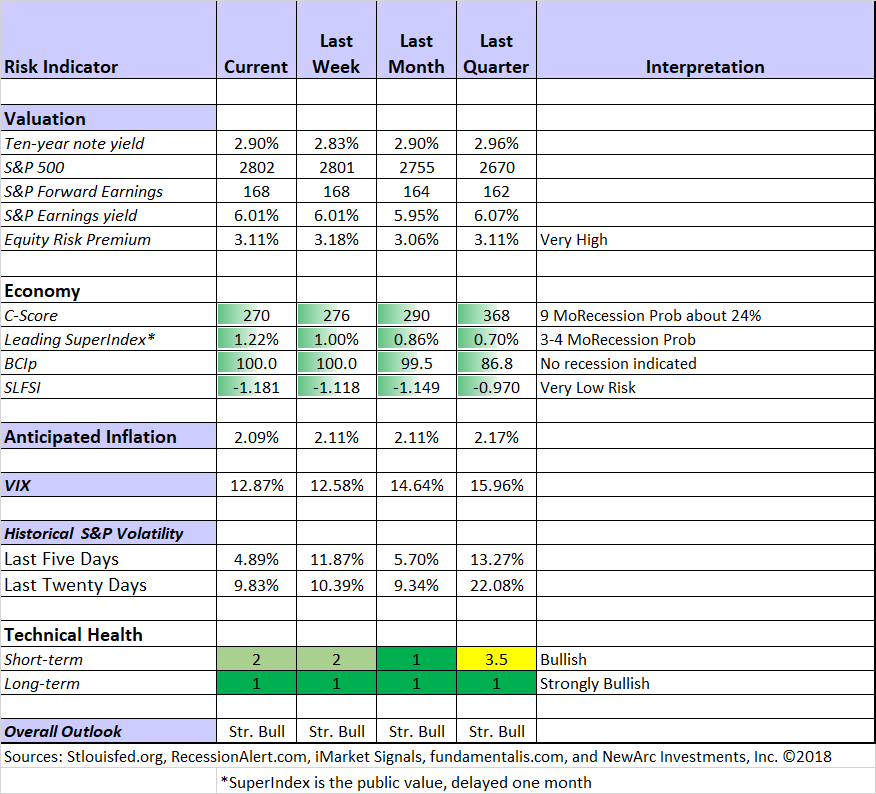
BH: That seems to corroborate well with the “Technical Health” data from Jeff’s most recent Weighing The Week Ahead, where his indicators show things are looking fairly healthy, as shown in the following table from his report.
Conclusion:
Different market participants have different timeframes for their positions. And whether you are a long-term investor or a short-term trader (or somewhere in between) you have to stick with what works for you. Our technical models have been designed to take advantage of specific trading opportunity setups over differing time periods. And we find that using a blended approach among our multiple models can helps us keep returns strong and risks/volatility lower.
Background On The Stock Exchange:
Each week, Felix and Oscar host a poker game for some of their friends. Since they are all traders, they love to discuss their best current ideas before the game starts. They like to call this their “Stock Exchange.” (Check out Background on the Stock Exchange for more background). Their methods are excellent, as you know if you have been following the series. Since the time frames and risk profiles differ, so do the stock ideas. You get to be a fly on the wall from my report. I am usually the only human present and the only one using any fundamental analysis.
The result? Several expert ideas each week from traders, and a brief comment on the fundamentals from the human investor. The models are named to make it easy to remember their trading personalities.
