The Stock Exchange is all about trading. Each week we do the following:
- discuss an important issue for traders;
- highlight several technical trading methods, including current ideas;
- feature advice from top traders and writers; and
- provide a few (minority) reactions from fundamental analysts.
We also have some fun. We welcome comments, links, and ideas to help us improve this resource for traders. If you have some ideas, please join in!
Review: Are You Selling The Rips Or Buying The Dips?
Our previous Stock Exchange asked the question: “Are You Selling The Rips Or Buying The Dips?” We noted that dip-buying strategies have been increasingly challenged in recent weeks. And with market uncertainty and intraday volatility higher, a “selling the rips” strategy has been getting more attention. The high intraday volatility continues; for example Wednesday we saw the market go from up significantly in the morning, to down significantly in the afternoon following the Fed’s interest rate announcement.
This Week: Is Technical Damage Driving This Market?
The market reacted badly to the Fed’s announcement on Wednesday, and the S&P 500 reached a new low for 2018. But just how bad is the technical damage? And is that really what’s driving this market?
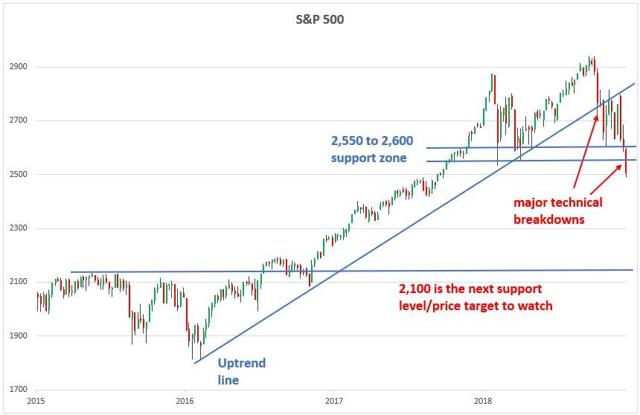
The above chart, from a recent post by Jesse Colombo suggests that “A Major Technical Breakdown Just Occurred In Stocks.” And Jesse is not alone. For example, Patti Domm at CNBC lends some support to this notion when she writes “The Market Is In No Man’s Land.
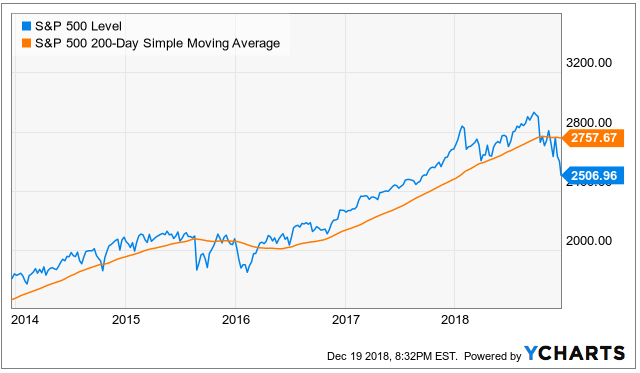
For additional perspective, this next chart shows how the S&P 500 can have a tendency to skip along its 200-day moving average. This basic technical trading indicator (200-day moving average) is used by so many market participants that it often serves as a magnet, and then support or resistance. However, when something sends the market through this level, many stops are often triggered, thereby increasing the market move.
For more information, we’ve written about trading around moving averages in the past:
Of course the market is not driven entirely by technicals. There are economic conditions and fundamental factors that matter. But those don’t necessarily seem to warrant such a sharp sell-off, according to Dr. Brett Steenbarger. Per his recent post, “What In The World Is Going On With The Stock Market?” it may not even be about the US market. He writes:
Perhaps what is going on in the U.S. stock market is not about the U.S. Perhaps it is not about President Trump; not about the daily dose of polarized, politicized commentaries from MSNBC, FOX, CNN; and not about chart patterns and wave counts of American markets.
Regardless of the volatile conditions, our technical models continue to find compelling trading opportunities. But before getting into the details of a few of our most recent trades, here is an update on the performance of our trading models.
Model Performance
We are sharing the performance of our proprietary trading models, as our readers have requested, as shown in the following table:
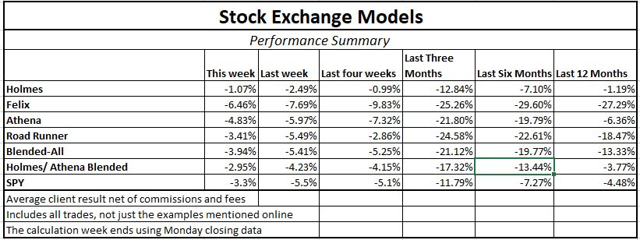
Worth noting, the model results look weak in various time frames, but it is actually a reflection of only the last month or so. Our system of exits is more complex (and more effective) than most simple, price-based methods. Without going into the details, it is a bit more “patient” than most. For perspective, the models do well in up-markets and flat markets. In large declines they outperform the general market via a complete exit. For more than a month we have been operating on the edge of the effective range – something that we report in the indicator snapshot each week on WTWA. The recent market action illustrates the effectiveness of our approach, which will start to show up in next week’s table. Unlike our models, systems that use aggressive stops have difficulty in re-entry. Our models are less likely to miss the subsequent rebound after the market sells off.
For more information about our trading models (and their specific trading processes), click through at the bottom of this post for more information. Also, readers are invited to write to main at newarc dot com for our free, brief description of how we created the Stock Exchange models.
Expert Picks From The Models:
Note: This week’s Stock Exchange is edited by Blue Harbinger, a source for independent investment ideas.
Blue Harbinger: Do any of you technical trading models have any trades to share with us this week? How about you, Holmes? I know you are our resident “dip buyer.” Any recent activity to share?
Holmes: This week I purchased AutoZone (NYSE:AZO) on a price dip, are you familiar with that company?
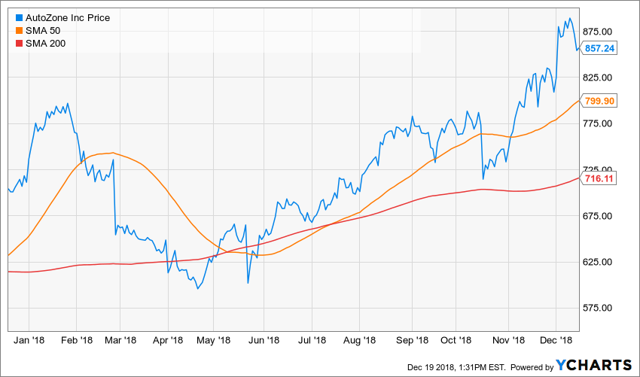
Blue Harbinger: Yes–AutoZone sells car parts and accessories. Are you thinking the recent market decline is an indication that the economy will weaken, and people will start spending more money on fixing their existing cars (to the benefit of AutoZone) instead of buying new cars?
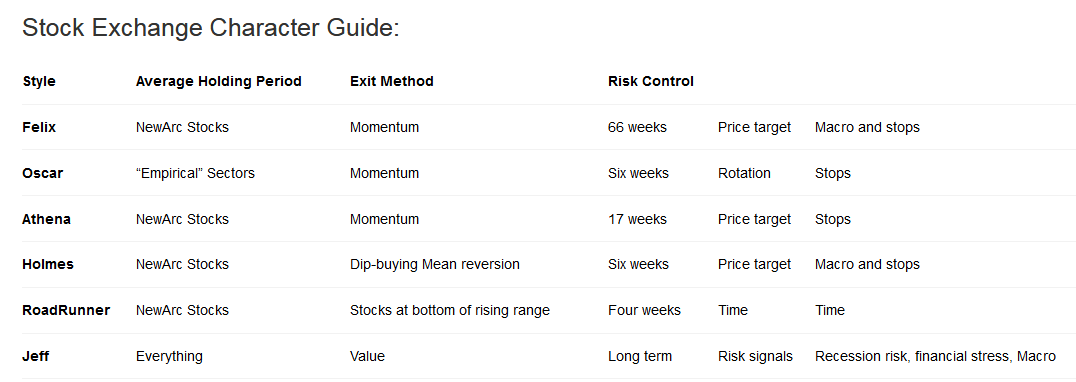
Holmes: No. That’s not at all what I am thinking. My typical holding period is only 6 weeks, so I’ll be out of this trade long before the phenomenon you described plays out–if it is even a real thing. Besides, the Fed just raised interest rates, which is an indication that they think the economy is strengthening.
BH: Do they really think the market is getting stronger, Holmes, or are they just trying to get rates back to a normal level so they have some dry powder available if things start to get really bad. You know Fed chair Jerome Powell just said he expects 2 more rate hikes in 2019, but the market thinks he’s full of it. According to the CME’s FedWatch tool, the futures market is thinking it’s more likely there will be zero rate hikes in 2019. Conditions aren’t so rosy out there Holmes.
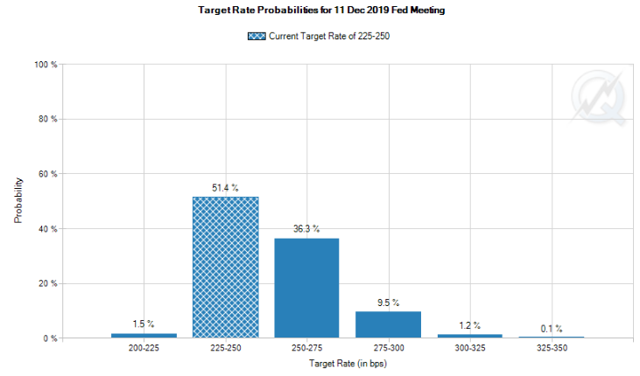
Holmes: Again, I typically hold for 6-weeks. Your full-year 2019 story is not all that important to my trade. And neither are the long-term fundamentals for AutoZone, but I’m sure you’re going to tell me something about fundamentals too.
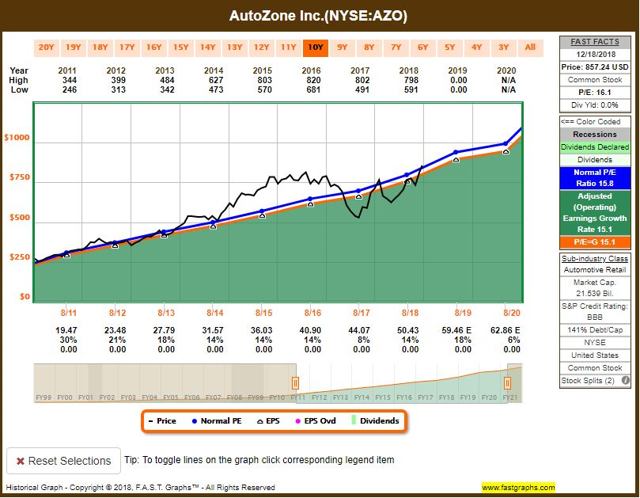
BH: I won’t get into the fundamental details since you’re not listening to me anyway, but if you change your mind, check out some of the fundamental data in Chuck Carnevale’s fantastic FastGraphs site. For example, here is some concise and powerful data for your to consider.
Holmes: Thanks. And how about you, Felix–any trades to share this week?
Felix: I bought Ctrip.com International (NASDAQ:CTRP) this week. Ever heard of it?
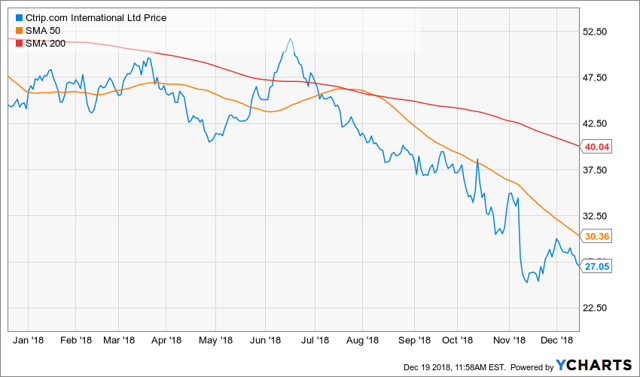
BH: Travel-related services? Ctrip provides hotel accommodations, airline tickets and packaged tours, and they’re headquartered in Shanghai, China. I don’t know much about the company, but I like the concept, and I think emerging markets (e.g. China) are really depressed right now, and this could be a good time to “buy low.” In fact, I do see in your chart that Ctrip is well below its 50-day and 200-day moving averages. Assuming the volume of the sell-off slows, this could be an interesting time to consider buying, but I am not really into trying to catch falling knives.
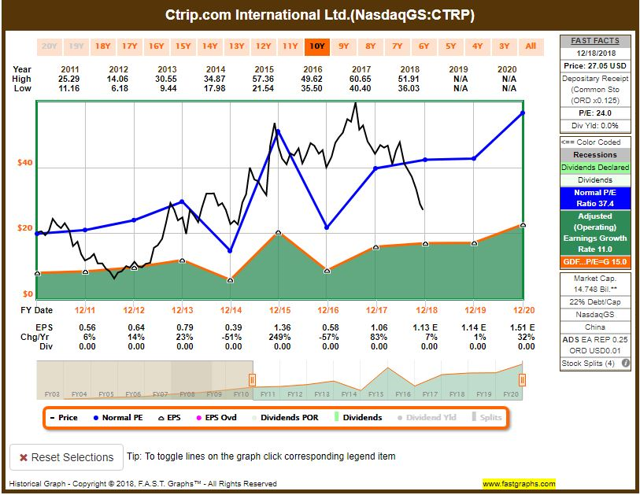
Felix: I hold for 66-weeks, on average. So I am not necessarily trying to bottom tick here. However, I am actually seeing various attractive momentum indicators for Ctrip, and that is why I bought the shares. I have a specific Ctrip price target in mind, and in case I am wrong I have stops in place. Plus I also monitor macro conditions closely on my trades.
BH: Well I can see Ctrip’s EPS recently broke out, and revenues have been accelerating. Perhaps that is the “momentum” you’re talking about. This will be an interesting one to keep an eye on, thanks Felix.
Felix: If you’re looking for something to “keep an eye on” Blue Harbinger, I also ran the 30 Dow Jones stocks through my model this week, and here are the top 20 rankings.

BH: That is interesting, Felix. I like those types of rankings. I see Procter & Gamble (NYSE:PG) ranks highly on your list. That’s a name I like because it’s a US company with significant emerging markets exposure. That exposure has held it back in recent years, but it could become a tailwind in the years ahead. Thanks for sharing. And how about you, Athena–any trades to share this week?
Athena: This week I sold my Zayo Group Holdings (NYSE:ZAYO) shares. I bought them at a higher price back on November 20, however I am using prudent discipline in accordance with my strategy and I sold the shares.
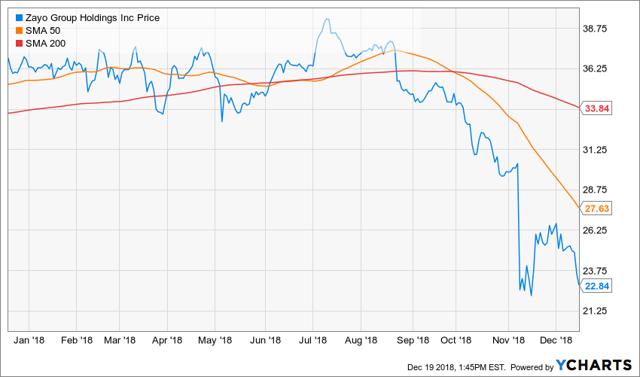
BH: Glad you are using “prudent discipline.” In this market it can make sense to take a few chips off the table, assuming that is consistent with your strategy.
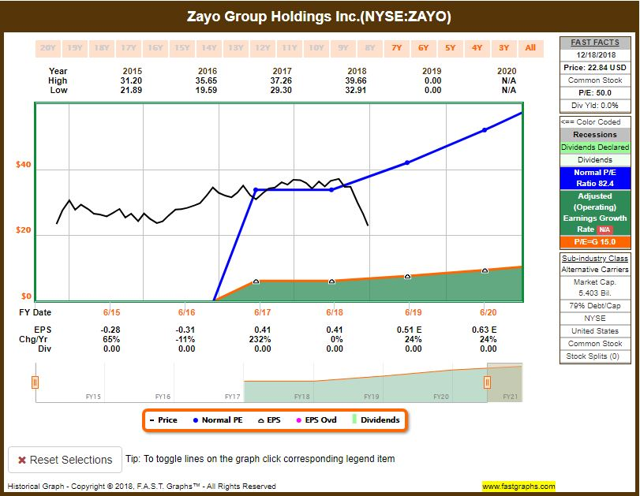
Athena: As you know, I am a technical trader, I am big on momentum, and my typical holding period is around 17 weeks. I run a “king of the mountain” best ideas strategy, and Zayo has fallen out of my top 10 list, therefore I sold.
BH: Got it. Thanks for the info. And how about you, Oscar- anything to share this week?
Oscar: This week I ran the High Liquidity ETFs with Price*volume over 100 million through my technical model. Here is the ranking of my top 20.

BH: I see the Gold Miners ETF (NYSE:GDX) at the top of your list. Are you betting on a little more market fear driving investors to the safety of gold?
Oscar: These are gold miners, not the commodity gold, but yes there is a correlation there. I also have utilities (NYSE:XLU) ranked highly–that’s another “flight to safety” trade. You might also appreciate that I have emerging market countries Brazil (NYSE:EWZ) and India (NYSE:INDA) ranked highly.
Conclusion
With volatility and uncertainty high, it can seem that technicals are increasingly driving the moves in the market. And while the Fed increased rates on Wednesday (and indicated they are expecting 2 more rate hikes in 2019), the market sold-off (again) and arguably broke a significant technical support level. Further still, the market sank further below its closely watched 50-day and 200-day moving averages, and thereby the S&P 500 set a new low for 2018. But before, you go running for the hills, recall that markets are driven by both technicals (often in the shorter-term) and economic and fundamental factors in the longer-term. Keeping these in mind, be sure you’re following a strategy that is consistent with your personal needs and goals.
Getting Updates
Readers are welcome to suggest individual stocks and/or ETFs to be added to our model lists. We keep a running list of all securities our readers recommend, and we share the results within this weekly “Stock Exchange” series when feasible. Send your ideas to “etf at newarc dot com.” Also, we will share additional information about the models, including test data, with those interested in investing. Suggestions and comments about this weekly “Stock Exchange” report are welcome. Your can also access background information on the “Stock Exchange” here.
