
The Stock Exchange is all about trading. Each week we do the following:
- discuss an important issue for traders;
- highlight several technical trading methods, including current ideas;
- feature advice from top traders and writers; and
- provide a few (minority) reactions from fundamental analysts.
We also have some fun. We welcome comments, links, and ideas to help us improve this resource for traders. If you have some ideas, please join in!
Review: Are There More Unnerving Face-Rippers Ahead?
Our previous Stock Exchange asked the question: Are There More Unnerving Face-Rippers Ahead? We noted the market’s recent tendency towards volatile daily “swings and fits” had created attractive trading opportunities, but suggested investors not lose sight of their personal goals in the market.
This Week: Are You Selling The Rips Or Buying The Dips?
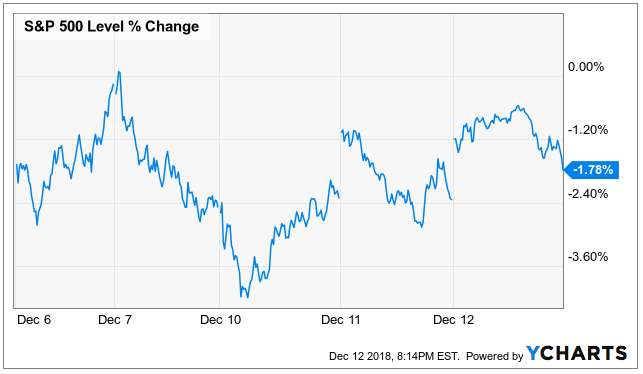
In a continuation of last week’s theme, the significant intraday volatility continues, and traders are taking differing viewpoints on how to play them. For perspective, the S&P 500 just completed its fifth straight day where it moved at least 2% between its intraday high and intraday low.
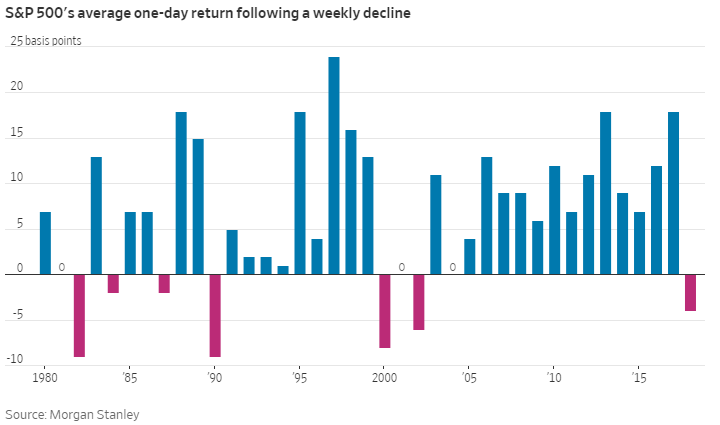
And according to Shawn Langlois, ‘Sell the rally’ has replaced ‘buy the dip.’ For example, earlier this week Shawn wrote:
After weeks like the train wreck that just passed, investors are supposed to come along and scoop up bargains, no? That’s been the norm for decades, after all. Alas, it’s not the norm any more, as this Wall Street Journal chart shows:
Interestingly, Ulli Niemann also highlight this recent changing market manta noting:
Yesterday’s rebound ran into resistance quickly, as traders were more comfortable adopting the mantra “let’s sell the rip” rather than believing the rally had substance to it.”
Building further off this changing trend, we highlighted a particularly good lesson that Dr. Brett Steenbarger has learned from famous trader, Victor Niederhoffer:
If you are part of the herd… there is no way to achieve distinctive returns… Identifying dominant market cycles within stable market periods allows the trader to know when markets are likely to exhibit momentum and when they are likely to reverse.
We’ll review specific “dip buying” and “rip selling” trades later in this report, but first a look at performance.
Model Performance:
We are sharing the performance of our proprietary trading models, as our readers have requested, as shown in the following table:
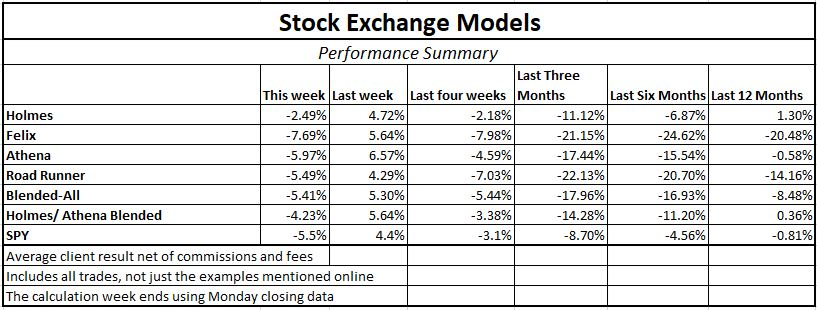
Worth noting, the model results look weak in various time frames, but it is actually a reflection of only the last month or so. Our system of exits is more complex (and more effective) than most simple, price-based methods. Without going into the details, it is a bit more “patient” than most. For perspective, the models do well in up-markets and flat markets. In large declines they outperform the general market via a complete exit. For more than a month we have been operating on the edge of the effective range – something that we report in the indicator snapshot each week on WTWA. The recent market action illustrates the effectiveness of our approach, which will start to show up in next week’s table. Unlike our models, systems that use aggressive stops have difficulty in re-entry. Our models are less likely to miss the subsequent rebound after the market sells off.
For more information about our trading models (and their specific trading processes), click through at the bottom of this post for more information. Also, readers are invited to write to main at newarc dot com for our free, brief description of how we created the Stock Exchange models.
Expert Picks From The Models:
Note: This week’s Stock Exchange is edited by guest author Blue Harbinger, a source for independent investment ideas.
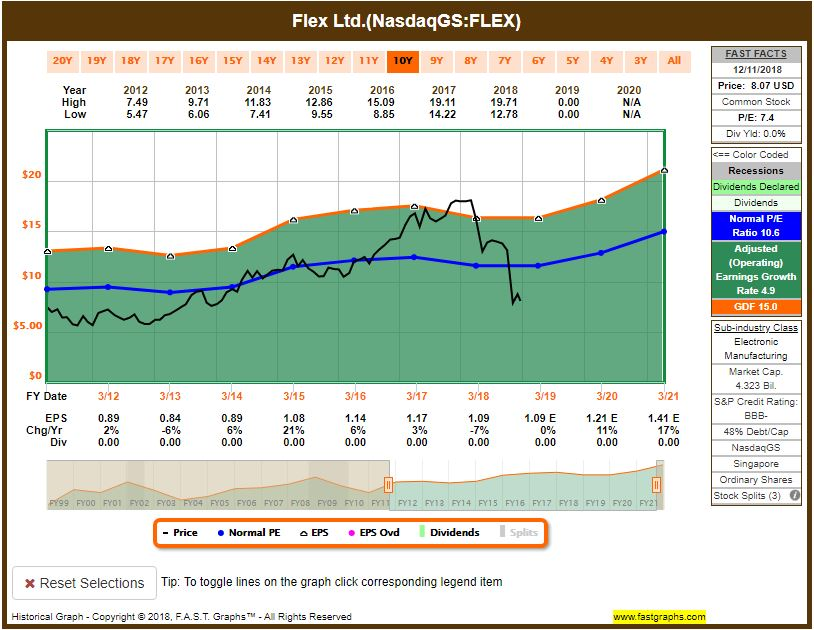
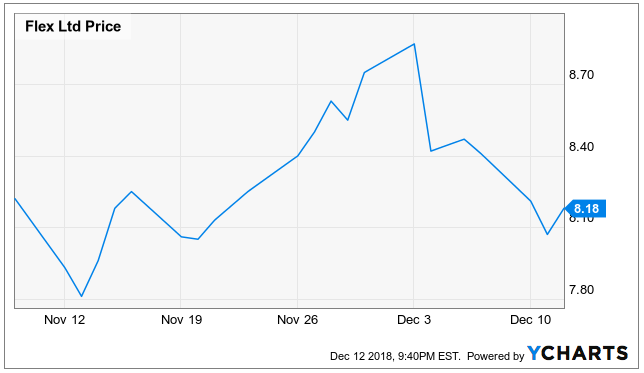
Felix: This week I purchased shares of Flex Ltd (MX:FLEXN)
Blue Harbinger: Why?
Felix: Because I am a trader, and I like to buy stocks with momentum. I typically hold for around 66-weeks:

BH: Momentum, Felix? That chart looks like the price has been going much lower over the last year. Perhaps you’re talking about earnings momentum? As you can see in the following Fast Graph, EPS has been rising, and is expected to keep rising, even though the price has gone lower.
Felix: If you’re so worried about the price going lower, perhaps it is helpful for you to know I have specific price targets in mind on my trades, and I use stops and monitor macro conditions for risk management purposes.
BH: I am a long-term investor, Felix. And I care about fundamentals. For your information, from a fundamental standpoint, this stock actually looks cheap to me considering the business has been improving. For example Flex (formerly Flextronics) used to manufacture parts almost exclusively for electronics companies, but they’ve been wisely diversifying into other industries in recent years. They also moved from just following customer manufacturing specifications, to actually working with some customers on design. I think this is smart too. The recent sell-off (which has been significant, Felix) probably has a lot to do with fears related to the recent China spat, but that will eventually end (and even be forgotten) and these shares could easily snap back and rise much higher.
Felix: I’d tell you I am happy you agree with my view on Flex, but I am a technical, non-human, trading model; I have no emotions, and that is one of my advantages versus humans.
Athena: While you two are going back and forth about your investment processes, I am chiming in to let you know I have had success trading in and out of Flex recently (e.g. buying the rips and selling the dips), and I am currently long the shares.
BH: Really?
Athena: Yes. I bought shares on November 27th, sold them at a slight profit on December 4th, and then purchased them back at a lower price this week on December 11th.
BH: That’s a lot of trades, Athena. Has something about that business fundamentally changed in the last two weeks?
Athena: As you know, I am a technical trader, and my typical holding period is around 17 weeks. However, with all the recent volatility–I have been buying the dips and selling the rips.
BH: That’s your strategy? Buy low, Sell high?
Athena: As you also know, I run a “king of the mountain” type strategy, and it takes a lot to get into my “best ideas” portfolio. I am also big on momentum too.
BH: Got it. Thanks for the info, and nice trade. And how about you, Holmes–any thing to share this week?
Holmes: I purchased Intelsat Sa (NYSE:I) on December 6th. I am a technical model focused on specific dip-buying opportunities.

BH: Holmes, Intelsat missed earning expectations by a large amount, and they announced this news at the end of October–that was a big contributor to the price decline (or dip, as you call it). Here is a look at the Fast Graph.
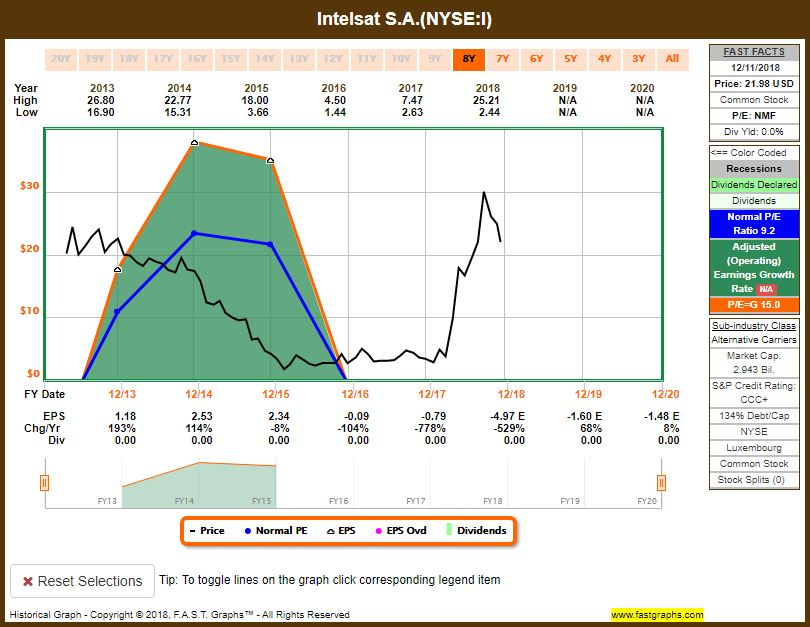
Holmes: Even though I am a technical trading model, I still know that the lower earnings was due to two large non-cash earnings adjustments. Revenue was still ahead of expectations.
BH: Okay Holmes, but to play devil’s advocate, aren’t you afraid “dip buying” is out of style in the market right now?
Holmes: First off all, I am a technical trading model, so no I am not “afraid,” and no I don’t fall for popular media narratives just because they sound good. Besides, my strategy is usually implemented in combination with one of the other models to help minimize the risks of a certain strategy’s style performance.
BH: Okay, thanks. And how about you, Road Runner–any trades to share?
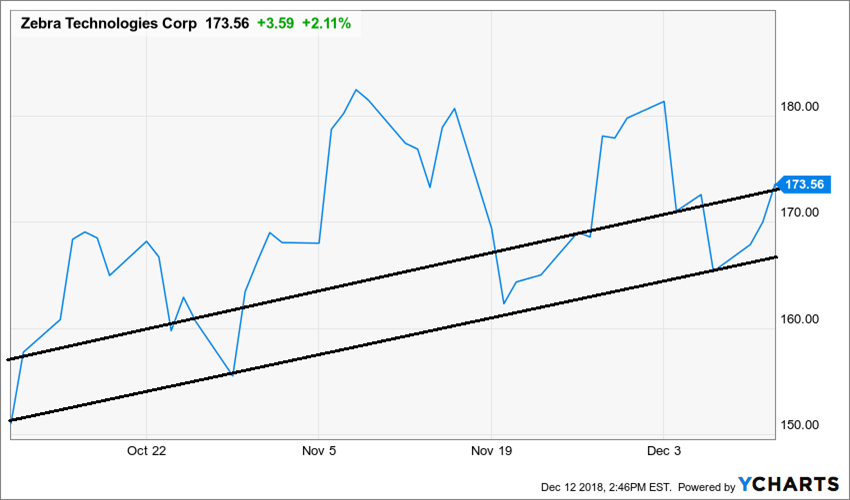
Road Runner: I purchased Zebra Technologies Corporation (NASDAQ:ZBRA), the bar code company, in the lower end of a rising channel, on December 6th.
BH: Looks like the shares are up since you purchased. When will you sell.
RR: My typical holding period is 4 weeks.
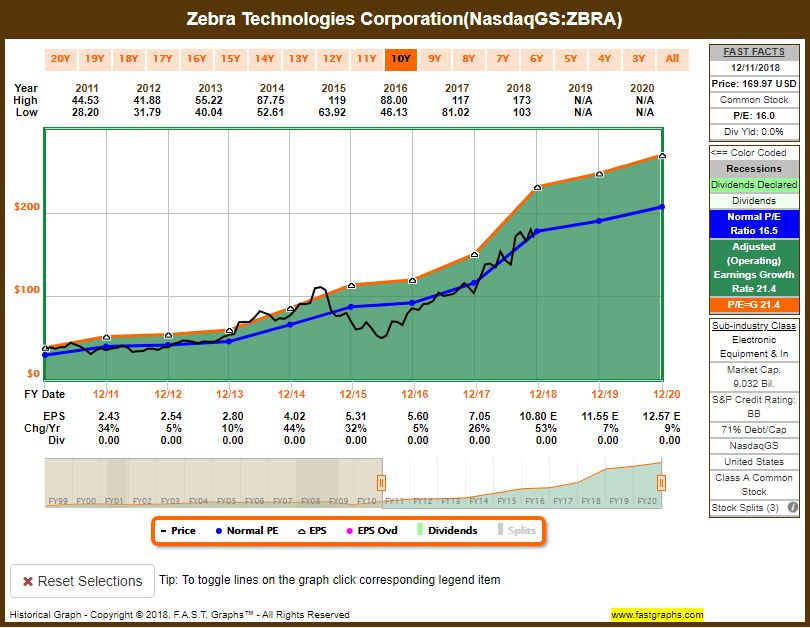
BH: Well if that same pattern in your chart holds up, that trade could be a big winner, but there is a lot more going on in the market from a macro and company-specific standpoint. For example, here is a look at the Fast Graph, if you feel like digging into some of the fundamental data.
RR: Great–and here is a look at a long-term chart if you feel like considering more of the technicals.

Conclusion:
Differing trading strategies can work better or worse depending on market conditions. For example, “selling the rips” has been having more success in recent weeks than normal, as compared to “buying the dips.” Recognizing changing market conditions can be helpful when deciding which trades to place, as well as how much of your trading dollars to allocate among strategies. We find that a blended approach can help keep risks lower while allowing for competitive and healthy long-term returns.

Getting Updates:
Readers are welcome to suggest individual stocks and/or ETFs to be added to our model lists. We keep a running list of all securities our readers recommend, and we share the results within this weekly “Stock Exchange” series when feasible. Send your ideas to “etf at newarc dot com.” Also, we will share additional information about the models, including test data, with those interested in investing. Suggestions and comments about this weekly “Stock Exchange” report are welcome. Your can also access background information on the “Stock Exchange” here.