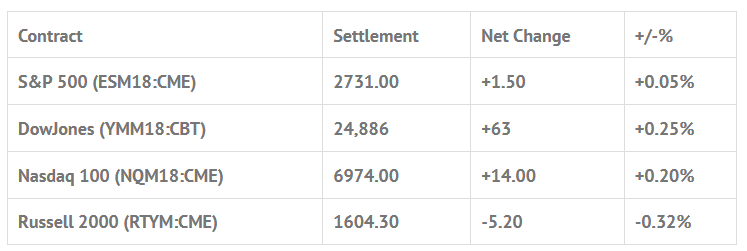
Index Futures Net Changes and Settlements:

Foreign Markets, Fair Value and Volume:
- In Asia 9 out of 11 markets closed lower: Shanghai Comp +0.58%, Hang Seng -1.23%, Nikkei -0.21%
- In Europe 9 out of 13 markets are trading higher: CAC +0.14%, DAX +0.12%, FTSE +0.20%
- Fair Value: S&P -0.87, NASDAQ +3.12, Dow -24.93
- Total Volume: 943k ESM & 858 SPM traded in the pit
Today’s Economic Calendar:
Today’s economic calendar includes Robert Kaplan Speaks 8:00 AM ET, Retail Sales 8:30 AM ET, Empire State Mfg Survey 8:30 AM ET, Redbook 8:55 AM ET, Business Inventories 10:00 AM ET, Housing Market Index 10:00 AM ET, John Williams Speaks 1:10 PM ET, and Treasury International Capital 4:00 PM ET.
S&P 500 Futures: #ES Sells Off But Eeks Out a Small Gain

Who needs legal gambling when you have the S&P 500 futures? After the major markets fell 10%, the S&P, Dow and Nasdaq have come flying back up. No one can deny the big rally, but the big question is, where has all the volume gone? With the 8 day rally continuing, and the May options expiration this week, one has to wonder of its time for a pullback. Every trader we talk to keeps saying the ES will fill the 2752.00 gap, but we are not sure that’s in the cards this week. The ES has rallied 150 handles in 8 days, and is overbought and over extended short term.
Yesterday started with a Globex trading range of 2727.25 to 2741.00, with only 119,000 contracts traded. On the 8:30 CT open the ES traded 2741.00. The initial move was up to 2739.75, followed by a pullback down to 2735.00, and then a rally up to 2741.25 just after 9:30, taking out the Globex high by 1 tick. From there, sellers began to come in with energy, pulling the ES down to 2732.75 at 10:45, and then rallying back up to 2738.75 just after 11:00 am. But then, the selling pressure increased, taking the futures down to 2726.25 just after 12:15, and then down to 2724.25 just after 1:15.
In the final part of the trading day the MIM began to show some size building to the sell side, as the ESM came off the lows and began to rally up to 2733.00 just after 2:00. The sellers really began to take over into the close as the actual MOC came out $1.1 billion to sell, and the ES dumped down to 2724.50. On the 3:00 pm cash close the ES printed 2729.75, and went on to settle at 2730.50 on the 3:15 close, up +1.00 handle, or +0.04%, barely salvaging the winning streak.
Disclaimer: Trading Futures, Options on Futures, and retail off-exchange foreign currency transactions involves substantial risk of loss and is not suitable for all investors. You should carefully consider whether trading is suitable for you in light of your circumstances, knowledge, and financial resources. Any decision to purchase or sell as a result of the opinions expressed in the forum will be the full responsibility of the person(s) authorizing such transaction(s). BE ADVISED TO ALWAYS USE PROTECTIVE STOP LOSSES AND ALLOW FOR SLIPPAGE TO MANAGE YOUR TRADE(S) AS AN INVESTOR COULD LOSE ALL OR MORE THAN THEIR INITIAL INVESTMENT. PAST PERFORMANCE IS NOT INDICATIVE OF FUTURE RESULTS.
