SPY Trends And Influencers May 18, 2019

Last week’s review of the macro market indicators saw heading into the May options expiration week equity markets had reset lower, but ended the week strong. This suggested the pullback might end. Elsewhere looked for Gold ($GLD) to pause in its downtrend while Crude Oil ($USO) continued to pullback in the uptrend. The US Dollar Index ($DXY) looked to continue to move sideways while US Treasuries ($TLT) were biased to continue higher.
The Shanghai Composite ($ASHR) might end its pullback while Emerging Markets ($EEM) were biased to the downside in the short run. Volatility ($VXXB) looked to settle back after a pop higher, easing the pressure on the equity index ETF’s $SPY, $IWM and $QQQ. Their charts showed decent resets lower in the SPY and QQQ with the IWM back in its range.
The week played out with Gold shooting higher but then giving up all the gains and more at weeks’ end while Crude Oil had trouble early then recovered as the week advanced. The US Dollar moved higher in its range while Treasuries moved up slowly on the week. The Shanghai Composite languished under long term resistance while Emerging Markets continued to move lower.
Volatility spiked Monday to a lower high before retracing the rest of the week. This eased pressure on equities. The Equity Index ETF’s reacted with a quick move lower Monday and then they recovered the rest of the week. The QQQ ended nearly unchanged with the SPY and IWM off slightly. What does this mean for the coming week? Let’s look at some charts.
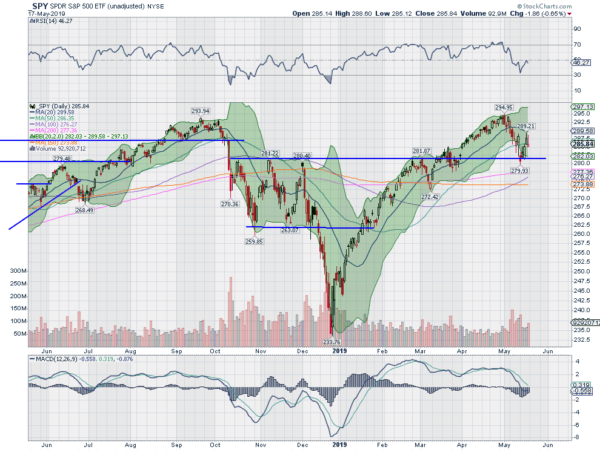
SPY Daily, $SPY

The SPY was showing signs that the latest pullback was over as it came into the week. That optimism faded quickly though as the market gapped down Monday. It continued lower all day closing at the lows. Tuesday saw buyers show up and a gap down open Wednesday was also bought intraday, closing higher. Thursday continued higher, closing the Monday gap. It could not hold up Friday with a gap down open that was bought but then saw late day selling.
It ended the week down only slightly. The daily chart shows the price holding at the 50 day SMA after bouncing off of a retest of prior resistance. The RSI is stalling at the midline with the MACD level and starting to turn back up for a cross. The upper shadows on the Thursday and Friday candles give a sense that the pullback may not be over.
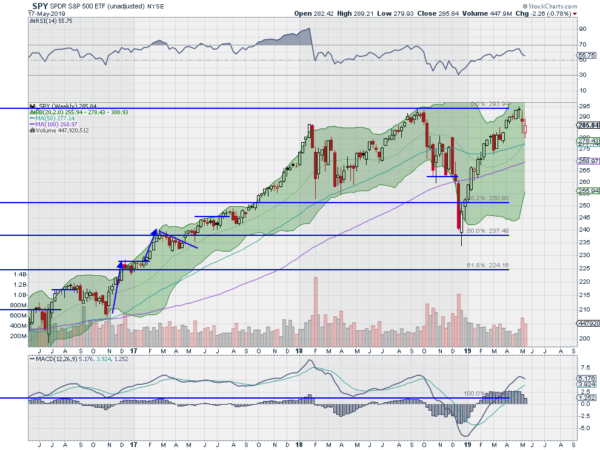
On the weekly chart, a hollow red candle shows intra-week strength despite the drop. The RSI is pulling back in the bullish zone, still above the midline, with the MACD turning towards a cross down. There is support lower at 285 and 284 then 282 and 280. Resistance higher comes at 287 and from 289.50 to 290.50 then 292 and 294. Pullback in Uptrend.
SPY Weekly, $SPY

Equities continued to experience some setbacks as the markets closed out May options expiration. Elsewhere look for Gold to continue its pullback while Crude Oil resumes the uptrend. The US Dollar Index looks to drift higher while US Treasuries are also biased to the upside. The Shanghai Composite remains stuck in its pullback while Emerging Markets continue the downtrend.
Volatility looks to continue to moderate easing the pressure on the equity index ETF’s SPY, IWM and QQQ. Their charts show intra-week strength in the pullbacks of the SPY and QQQ with the IWM stuck in a range. All 3 look weaker on the daily charts. Use this information as you prepare for the coming week and trad’em well.
The information in this blog post represents my own opinions and does not contain a recommendation for any particular security or investment. I or my affiliates may hold positions or other interests in securities mentioned in the Blog, please see my Disclaimer page for my full disclaimer.
