December Monday 12: Five things the markets are talking about
On the calendar front this is a busy week in capital markets.
The Fed is expected to increase fed funds for the first time in 12-months. On Wednesday, the FOMC will issue both its policy statement and quarterly forecasts while Janet Yellen will take questions that will bridge “present policy with pending stimulus” under the Trump administration. A +25bps, only the second hike of the cycle, is widely expected.
The Bank of England (BoE) will also announce its monetary policy decision (Dec 15), a decision that will be closely watched given the uncertainties surrounding the upcoming Brexit negotiations.
Elsewhere, flash manufacturing, services and composite PMI’s will give an early view of how the Eurozone, German and French economies are faring so far this month.
In Asia, Japan’s Tankan Survey will gauge the health of the economy, while in China, November industrial production (IP) and retail sales will be released as capital markets continue to get a handle on how their economy is doing.
1. Global stocks only see one color, black….
On Friday, U.S equities printed new record highs, capping their best week since the presidential election on Nov 9. Their gains extend a month long rally for stocks as investors pour money into companies that benefit from stronger economic growth and fiscal stimulus.
In particular, the banking sector has been one of the biggest net gainers, benefiting in anticipation of a wider difference between short- and long-dated government bonds and higher growth stateside.
Overnight, China’s crackdown on stock purchases by insurance firms sent local bourses into the red, while markets elsewhere in Asia pared their early gains made on the back of crude prices.
The Shanghai Composite Index ended down -2.5%, the biggest one-day drop in six-months. The Shenzhen Composite Index ended -4.9% lower, the biggest daily drop in 10-months.
Elsewhere, the Nikkei 225 jumped +0.8% on the back of a weaker yen (¥116.00), giving it a gain of +0.6% on the year after plunging as much as -21% through June.
In Europe, equity indices are trading generally lower, but are consolidating around last week’s highs. Energy, commodity and mining stocks are leading the gains across the board as crude prices surge. Financials are trading mixed with Italian banks and peripheral lenders trading sharply higher.
Stateside, U.S futures are set to open small down at –0.1%.
Indices: Stoxx50 -0.1% at 3,194, FTSE -0.2% at 6,942, DAX -0.4% at 11,161, CAC 40 -0.1% at 4,761, IBEX 35 flat at 9,167, FTSE MIB +1.4% at 18,543, SMI -0.3% at 8,075, S&P 500 Futures -0.1%
2. Oil spikes, gold trades atop of new lows
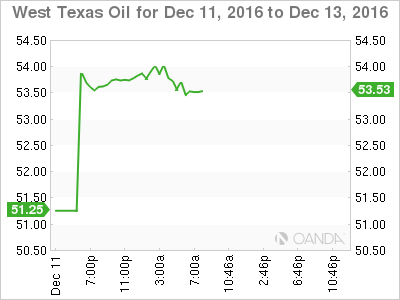
Crude prices have spiked more that +5% since the weekend as non-OPEC producers cut an agreement. Also helping ‘black gold’ is rhetoric, the Saudi’s seem optimistic about being able to cut production more than anticipated. Saudi Energy Minister al Falih indicated that his country could go beyond their commitment at last months OPEC meeting (-10.058M bpd) – their are willing to lower their output below the psychologically significant -10M bpd level depending on market conditions.
Non-OPEC producers agreed to cut -558K bpd of production for six-months starting on Jan 1. It’s a deal that could be extended for another six-month and one that Russia backs to speed up oil market stabilization and reduce volatility.
Brent futures are up +$2.38 at $56.72 per barrel, after having hit a session high of +$57.89, the highest in 17-months. U.S crude futures are up crude futures are up +$2.46 at +$53.96 a barrel ahead of the U.S open.
Note: Overnight prices are +50% y/y, marking the largest rise on any given day in five-years.
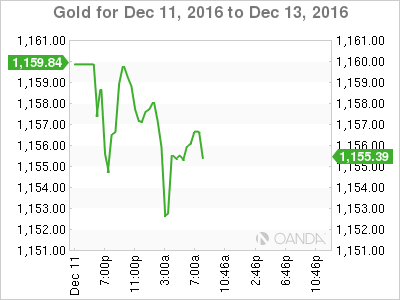
It’s natural to see gold prices pull back overnight as investor’s position themselves ahead of an expected Fed hike this week. The precious metal fell -0.4% to +$1,153.31 a troy ounce ahead of the U.S open.
3. Psychological yield levels broken
With crude oil surging to the highest level in 17-months is helping to push U.S. 10-Year treasury yields above the psychological +2.5% (+2.514%) threshold on inflation expectations for the first time in two-years.
Expect U.S yields to come under further pressure over the next two-days as dealers prepare to take down more product in the ten- and long-bond auctions stateside today and Tuesday.
Note: Hedge funds have raised the bearish bets for the benchmark 10’s to the highest level in two-years last week, more than doubling them to a net 228k.
Elsewhere, JGB 10-year yields have climbed +3bps, while yields on Aussie debt have backed up +4bps to +2.86%, while Kiwi yields rally to +3.31%.
4. Commodity currencies defy expectations
Yield differentials continue to support the dollar as it maintains its steady tone ahead of this week’s Fed rate announcement where its expected to hike rates a token +25bps for the first time in 12-months.
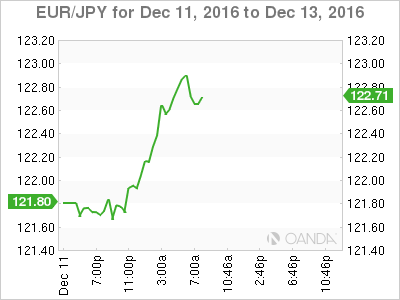
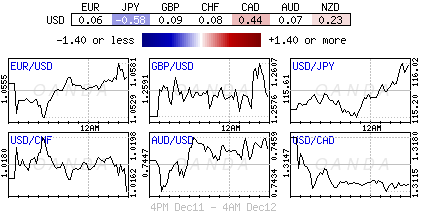
The Euro’s single currency lingers just below the psychological €1.06 level in quiet trading while the USD/JPY pair printed a fresh 10-month high above the ¥116 level.
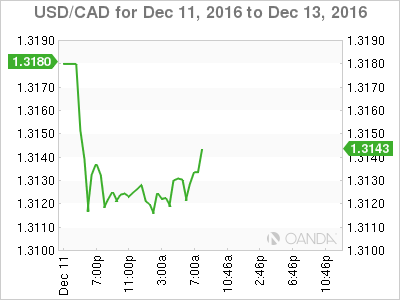
Elsewhere, oil-linked currencies are surging against the buck after non-OPEC producers agreed to slash production. The RUB is up over +2% outright, while the CAD is up +0.4% at CAD$1.3129 and the NOK is up +0.6% ($8.4346).
The safe-haven currencies JPY (¥116.00) and CHF ($1.0154) remain sold off as the latest futures report indicate that net short positions among speculators remain at 12-month highs.
5. Italy prepared to lend a hand
Ahead of the U.S open, the Italian government indicated that they are prepared to recapitalize troubled lender Banca Monte dei Paschi di Siena SpA (OTC:BMDPD) should the institution fail to get the required capital to stay afloat from private investors.
On the weekend, the institution said it would reopen a debt-to-equity swap offer in an attempt to complete a +€5B recapitalization program before year-end after the ECB on Friday rejected its request for more time to complete its plan. The bank has +€28B worth of bad loans on its books.
To date, the bank had already offered its bondholders to swap +€4.3B of subordinated debt into shares, however, they were only able to raise +€1B in fresh capital and reason why the Italian government remains on stand by.
This article is for general information purposes only. It is not investment advice or a solution to buy or sell securities. Opinions are the authors; not necessarily that of OANDA Corporation or any of its affiliates, subsidiaries, officers or directors. Leveraged trading is high risk and not suitable for all. You could lose all of your deposited funds.
