Asia stocks rise tracking Wall St gains; RBA minutes, Japan FX stance in focus
In theory, there’s a strong case for building portfolios based on risk factors. In practice, the jury’s out.
The transition from academic research to real-world portfolios, as usual, is a rocky affair. The results you achieve will depend on the factors you hold (and don’t hold), the funds you select to represent the factors, the weights you assign the factors, and the rebalancing schedule. Given that a huge range of portfolio designs are possible from adjusting those variables, it’s not surprising that results will vary, perhaps dramatically.
As a simple test, let’s build a smart-beta portfolio using ETFs and compare the results with a conventional S&P 500 ETF. As a preview, the results don’t look encouraging: the multi-risk-factor portfolio more or less tracks the S&P. That may be due to the naïve design of the factor portfolio, which we’ll define in a minute. But as a first step in exploring how an ETF-based factor portfolio performs let’s begin with a strategy that’s intuitive in the sense that it throws together a broad mix of the obvious risk exposures via the following eight funds:
* iShares Edge MSCI Minimum Volatility (NYSE:USMV) – low-volatility
* Vanguard High Dividend Yield (NYSE:VYM) – high-dividend yields
* Guggenheim Invest S&P 500 Equal Weight (NYSE:RSP) – small-cap bias within large-cap space
* iShares Edge MSCI USA Quality Factor (NYSE:QUAL) – so-called quality stocks
* iShares Edge MSCI USA Momentum Factor (NYSE:MTUM) – price momentum
* iShares S&P Small-Cap 600 Value (NYSE:IJS) – small-cap value stocks
* iShares S&P Mid-Cap 400 Value (NYSE:IJJ) – mid-cap value stocks
* iShares S&P 500 Value (NYSE:IVE) – large-cap value stocks
The motivation for holding a broad set of factors rather than just one or two? Risk management. Some analysts recommend diversifying across risk factors, although not everyone agrees. The standard approach is to use, say, a small-cap value fund to supplement exposure to standard large-cap equity allocation to boost expected return. The question here is whether holding a broad allocation of different risk factors is superior to owning the stock market via a conventional index?
For the test, we’ll equal weight this mix and rebalance back to equal weights at the end of each calendar year. The glitch is that the historical data is limited. The underlying concept for targeting specific risk factors has been around for decades, but several of the smart-beta products in the list above are only a few years old. As a result, the portfolio test below begins in July 2013.
Yes, that’s a ridiculously short time span and so the results below should be taken with a grain of salt. But let’s ignore that caveat for now and see what the cat drags in.
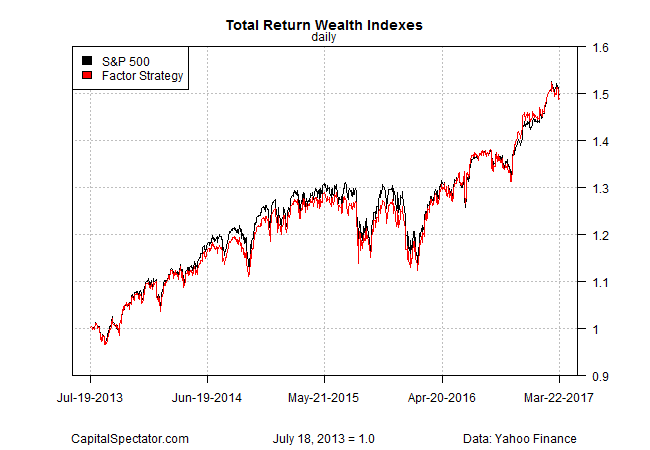
The main question: how does the factor strategy compare with a conventional index of US equities? Let’s use the SPDR S&P 500 ETF (NYSE:SPY) as the benchmark. As the chart below shows, the factor strategy and the S&P 500 track one another closely (correlation is 0.99).

Based on a start date of July 13, 2013 through yesterday (March 22, 2017), the factor strategy generated an annualized 11.4% total return, which is slightly below SPY’s 11.6%. Note, however, that the results are before subtracting the trading costs for rebalancing the factor strategy. The S&P portfolio, by contrast, is buy and hold and so there are zero rebalancing expenses.
Adjusting for risk doesn’t change the comparison. Profiling via Sharpe ratio, for instance, reveals virtually identical results: 0.92 for the factor strategy and 0.91 for SPY.
What happens if we increase the frequency of rebalancing to a monthly schedule? Not much. The factor strategy’s risk/return profile is roughly the same regardless of whether the portfolio is rebalanced monthly or at the end of each calendar year.
Does this mean that factor investing is worthless? No, not at all. But what the test above suggests is that earning a sizable premium over a conventional cap-weighted strategy may be tougher than it appears from the research.
To be fair, the history above is too short to draw conclusions. Also, it’s debatable if owning eight different factor funds is optimal. Would we do better by selecting a subset or dynamically managing the weights?
Keep in mind, too, that the S&P 500 has enjoyed an unusually strong run in recent years, which raises the possibility that a broadly diversified factor strategy may deliver more encouraging results in relative terms in the years ahead if the S&P’s performance reverts to its lower long-term track record.
In future posts I’ll consider alternative tests for analyzing ETF-based factor strategies. Meantime, the results above suggest that swapping conventional cap-weighted funds for factor funds may not be a short cut for materially boosting performance and/or lowering risk.
