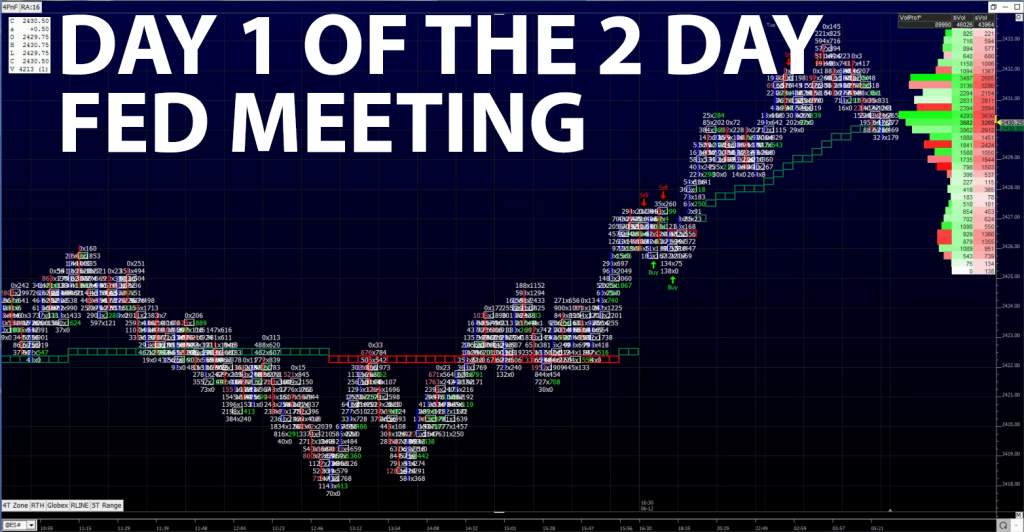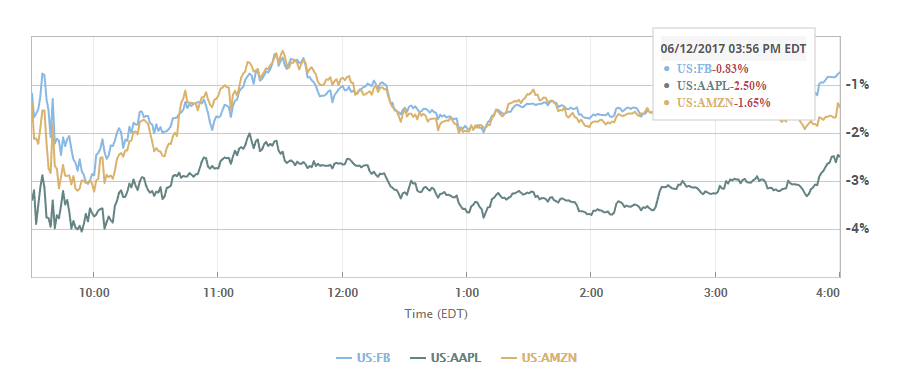
After closing at 2428.00 on Friday, the S&P 500 futures (ESU17:CME) sold off Sunday and into Monday morning, down to 2419.75, and then short covered just before the 8:30 open. Just after the open (all eyes on the Nasdaq) the CMEs Nasdaq 100 futures (NQU17:CME) got hit by an opening sell program that pushed the futures down to 5643.25, down over 1.4%, and taking the (ESU17:CME) down to an early low at 2416.75, 3 handles lower than the Globex low. After the subsequent lows, both futures started to grind higher.
By 10:20 CT the ESU traded all the way up to 2426.00, and the NQU had traded back up to 5727.75, then in came another round of selling, pushing both futures back down to 2417.75 and 5675.00 accordingly. It’s a big game of ‘shake and bake,’ and it really is about the PitBulls rule of taking profits and replacing. Just like the MrTopStep trading rule that says; get in, get out, and never fall in love with your position.
Pops and Drops
After the midday selloff, both futures started going back up. By 12:30 the ESU traded 2422.75 and the NQU pushed back up above the 5700.00 area. Despite the ‘overall weakness,’ the ES wasn’t as firm as it was on Friday when the NQ started to short cover. The NQ made a push higher, but the ES just didn’t pop, it acted like it was anticipating further NQ weakness. After making its third higher low at 2419.75, the NQU rallied back up to the 5713.00 area at 2:46.
The MiM started showing over $200 million to buy, and when it ‘flipped’ to $165 million to sell, both the ES and NQ popped up to 2424.50 and 5606.00. After another little dip the MiM did a small flip from $220 million to sell to $120 million to sell. From 1:55 cst to the 2:45 cash imbalance, the ESU was stuck in a 4 handle range. At 2:45 the imbalance showed $390 million for sale. On the 3:15 futures close the ES settled at 2427.00, down 1.75 handles on the day, and the NQU closed at 5722.00, down 29 points.
In the end after the initial drop and pop the index futures markets went into a long grind. Most of the volume came from the ES mini spread and Globex.
While You Were Sleeping

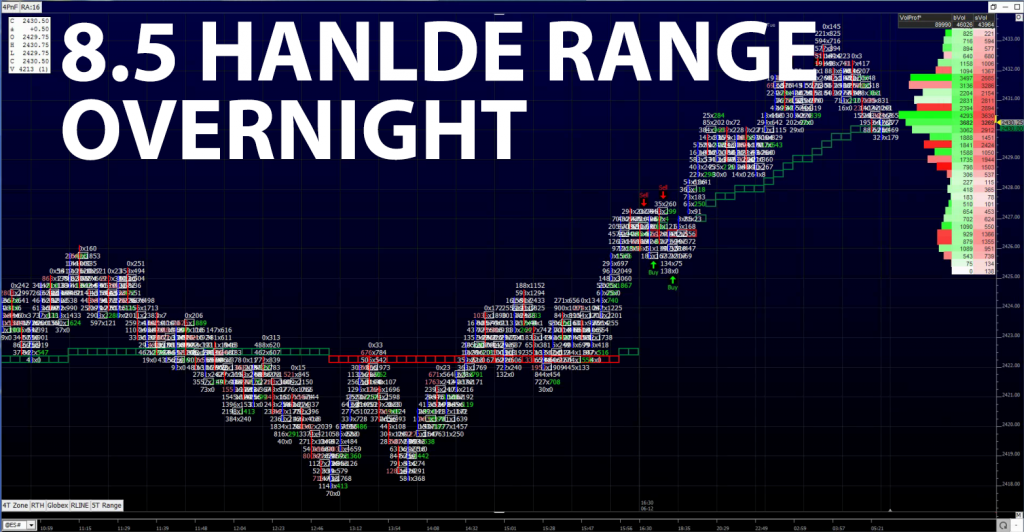
Overnight, equity markets in Asia traded strong, led by the ASX 200, which closed up +1.67%. The strength in Asia followed through into the European session, where all majors are currently trading higher. In the U.S., the S&P 500 futures opened the globex session at 2426.50 and immediately found a low at 2427.25. As the Asian markets opened, the ESU spiked, and found an early high at 2403.50. From there, the futures traded sideways for much of the night, until the European open when the ESU spiked again, and printed a new high at 2435.75. As of 6:30 am cst, the last print in the ES is 2432.25, up +3.75 handles, with 178k contracts traded.
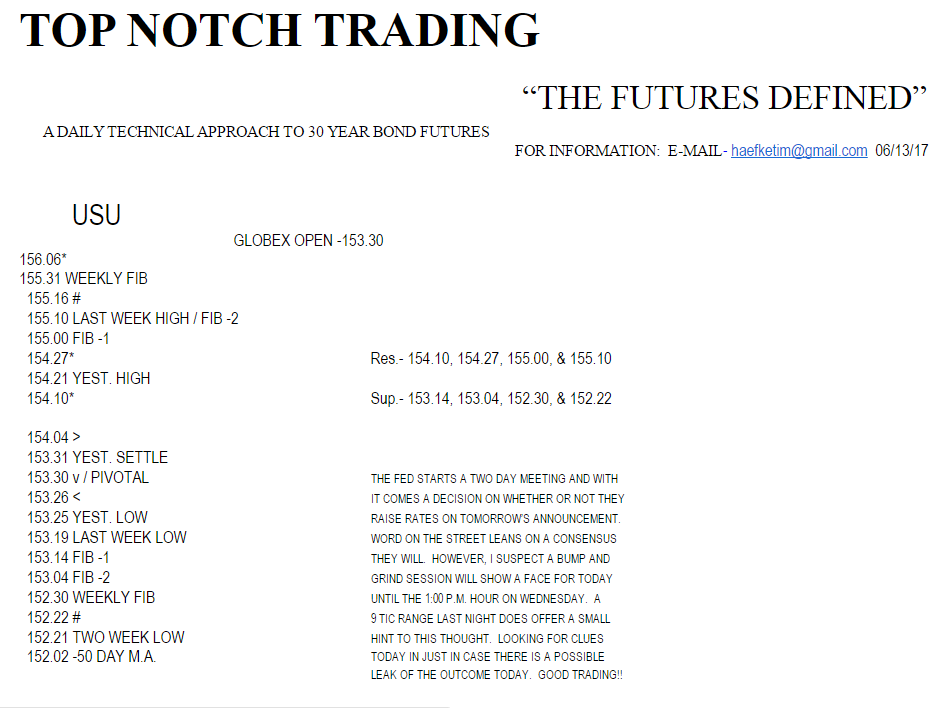
In Asia, 9 out of 11 markets closed higher (Shanghai +0.46%), and in Europe 12 out of 12 markets are trading higher this morning (FTSE +0.06%) Today’s economic calendar includes the FOMC Meeting Begins, NFIB Small Business Optimism Index, PPI-FD, Redbook, a 4-Week Bill Auction, a 30-Yr Bond Auction, and William Dudley Speaks.
Fed Time
Our View: I think there are a lot of moving parts to the stock market right now. North Korea is still testing its intercontinental rockets, Iran and its proxies are testing U.S. resolve in Syria, FAANG stocks are taking some big hits, the continued rotations between the Nasdaq, Dow and S&P, and this weeks two day fed meeting, just to name just a few. It all adds up to uncertainty, and we all know the markets hate uncertainty. That said, the two day fed meeting may slow the bears down and give the bulls an opportunity to help push the ES back up.
The big question remains, is the tech stock selling just a short term profit taking phase, or is there a lot more selling to come? The Nasdaq Comp. is still up 12% YTD, so one would think there could be more selling to come, but it could be just a short term shake out, and if so, ESU 2450 could be a reality. Our view; despite the weakness and negative price action, the ES feels like it wants to go up. You can take it from there.

PitBull: cln osc -33/-3 turns up on a close above 4460 esm osc 7/11 turns up on a close above 244304 vix osc 3/-2 turns down on a close below 1036.

