Equity markets continued trading in the green territory yesterday and during the Asian morning today, while oil prices rallied on expectations that demand will start recovering as several nations around the globe have begun to ease their lockdown measures. In the FX world, the franc and the euro were the main losers after the German constitutional court gave the ECB three months to justify its bond purchases. As for today, the spotlight may turn to the US ADP employment report for April.
EQUITIES TRADE HIGHER ON EASING LOCKDOWN MEASURES
The dollar traded higher against the majority of the other G10 currencies on Tuesday and during the Asian morning Wednesday. It gained versus CHF, EUR, AUD, GBP, and NZD in that order, while it underperformed against SEK, NOK, JPY and CAD.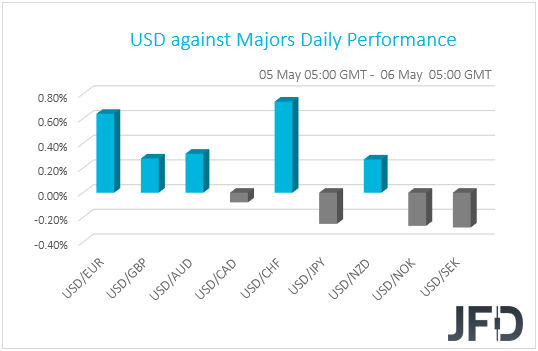
The strengthening of the dollar and the yen, combined with the weakening of the risk-linked Aussie and Kiwi, suggests that risk appetite took a hit at some point during the day. However, the relative strength of the Canadian dollar and the weakening of the Swiss franc points otherwise. Given that the FX performance paints a blurry picture with regards to the broader market sentiment, we prefer to turn our gaze to the equity world.
There, major EU indices gained on average around 2%, led by the oil and gas sector, as crude oil prices rallied, perhaps on expectations that demand will start recovering, as several nations around the globe have begun to ease restrictive measures imposed due to the fast spreading of the coronavirus. Wall Street also opened higher, but all three of its main indices came off their highs after Fed Vice Chair Richard Clarida said:
“We are living through the most severe contraction in activity and surge in unemployment we’ve seen in our lifetimes.”
Still though, US indices finished in positive territory, with the relatively positive morale rolling into the Asian session today. China’s first trading day after Thursday found Shanghai’s Composite Index up 0.26%, while Hong Kong’s Hang Seng and South Korea’s KOSPI gained 1.15% and 1.53% respectively. Japanese markets stayed closed due to another holiday.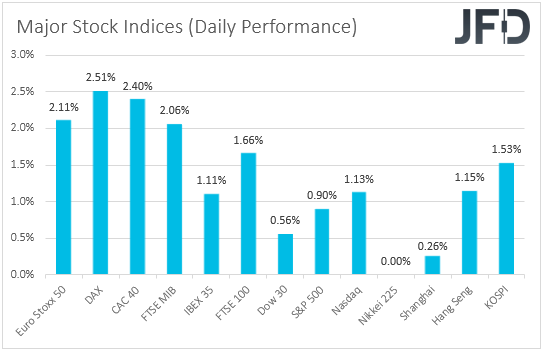
The recovery in the broader market sentiment is in line with our latest view. Remember that since Thursday, we’ve been noting that with unprecedented monetary and fiscal stimulus and the possibility of a vaccine being ready for distribution soon, we are now more trustful with regards to a recovery in risk-linked assets and a potential slide in safe havens. The easing of the lockdown measures seems to be providing additional support, but it also carries a risk. As we noted yesterday, lifting the restrictions too quickly and too soon may result in the virus start spreading at an exponential pace again, taking us back to square one.
FTSE 100 – TECHNICAL OUTLOOK
Looking at the technical picture of FTSE 100 on the 4-hour chart, we notice that the index seems to be struggling to find a clear direction, in which it could move further. On one hand, the index is still above a short-term tentative upside support line taken from the low of April 3rd, and on the other, the buyers are finding it hard to push the price above the 5866 barrier, which is currently the highest point of this week. For now, we will take a neutral stance and wait for a clear break of one of our key levels, before examining the next directional move.
If, eventually, the FTSE 100 makes a run above the 5866 barrier and in addition to that travels above the 5942 hurdle, which is the high of April 14th, this may attract more buyers into the game. The index could then drift to the 6206 hurdle, which is the highest point of April. The price might get a hold-up around there, or even correct slightly lower.
However, if the price continues to balance above the 5942 area, the bulls may re-enter the field and lift the FTSE 100 higher. If this time the index overcomes the 6206 barrier, this will confirm a forthcoming higher high and then next resistance hurdle could be around the 6401 level, marked by the low of March 6th.
Alternatively, if the aforementioned upside line breaks and the price falls below the support area between the 5625 and 5660 levels, marked by the lows of April 21st and May 3rd, this would confirm a lower low, which may invite a few extra sellers into the game. The FTSE 100 might then drift to the 5522 obstacle, a break of which could send the index to the 5321 zone. That zone marks the low of March 27th.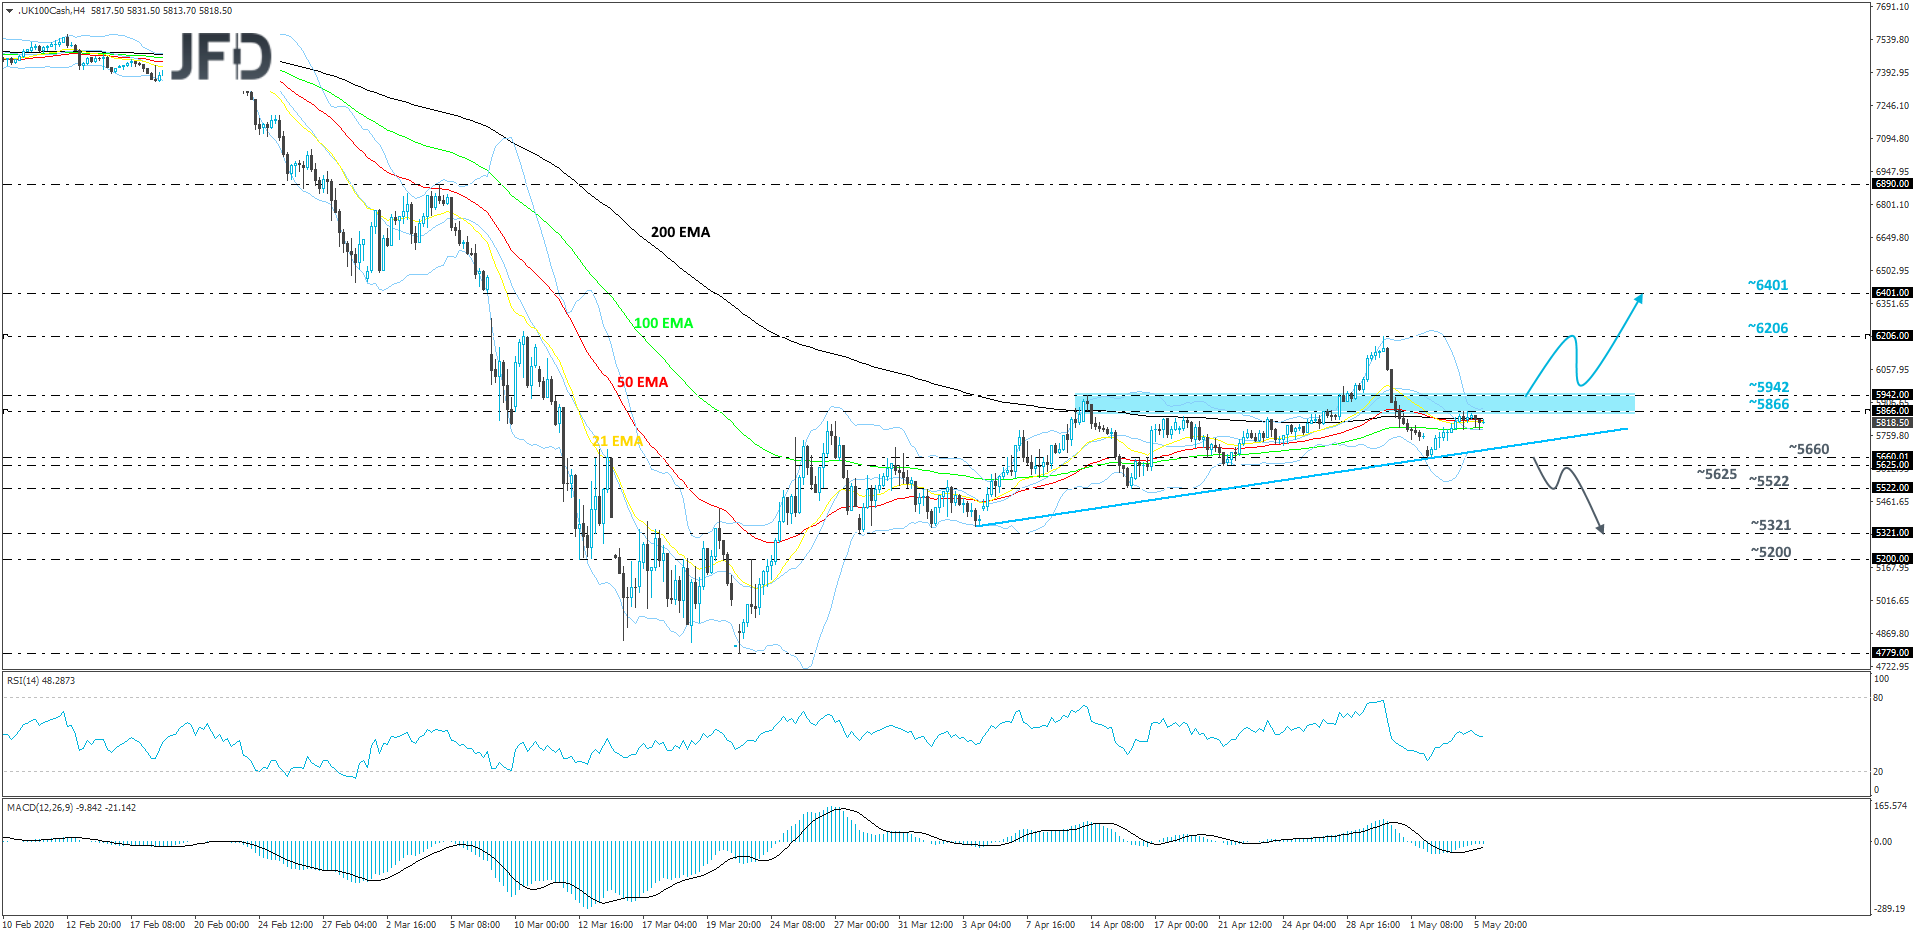
EUR AND CHF SLIDE ON GERMAN’S COURT RULING, ADP (NASDAQ:ADP) REPORT IN FOCUS
Back to the currencies, the euro was the second loser in line, coming under selling interest after the German Federal Constitutional court gave the ECB three months to justify purchases under its bond-buying program. If the central bank fails to do so, the Bundesbank will withdraw its participation from the scheme, the court said.
The Swiss franc also came under selling pressure at the time of the announcement, and strangely lost more than the common currency. One possible explanation for that may be a pick-up in intervention practices by the Swiss National Bank. Remember one of the Bank’s policies is to prevent the franc from strengthening, and with the euro sliding on the aforementioned news, the Bank may have stepped in to prevent its currency from outperforming its Eurozone counterpart.
As for today, market participants may pay extra attention to the US ADP employment report for April. Expectations are for the private sector to have lost 20mn jobs, after losing 27k the prior month. With continuing jobless claims hitting 18mn last week, 20mn job losses will not come as a surprise to us. Something like that could increase speculation that the NFP number, due out on Friday, may also come close to that number. Expectations are for the NFPs to have slid 22mn.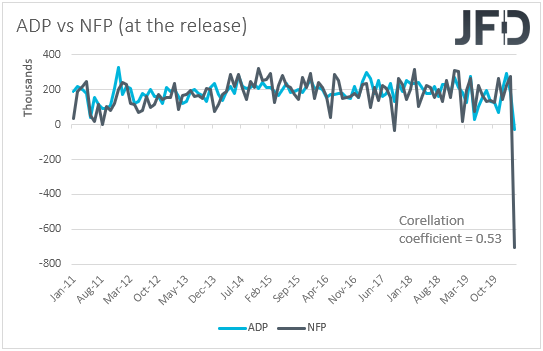
Such a historic number of job losses may confirm that the labor-market wounds due to the coronavirus spreading have been really deep and may hit equities. Paradoxically, since it has been wearing its safe-haven suit recently, the greenback may strengthen. That said, we expect a potential reaction to be limited and short-lived. The continued high prints of the weekly initial jobless claims since mid-March may have already prepared market participants for extremely bad ADP and NFP numbers.
EUR/USD – TECHNICAL OUTLOOK
After hitting the area slightly above the 1.1000 level last week, EUR/USD reversed and took course south again, falling below all of its EMAs on the 4-hour chart. In addition to that, both the RSI and the MACD are running below their equilibrium levels, pointing lower, detecting negative momentum. Yesterday, the pair got a hold-up near the 1.0826 territory, but after a small rebound, the rate is showing signs again that it is willing to continue with its journey south. For now, we will take a somewhat bearish approach, at least in the near term.
A drop below the 1.0826 hurdle would confirm a forthcoming lower low and allow the bears to push the pair further down. That’s when EUR/USD could test the 1.0784 obstacle, a break of which may clear the way to the 1.0727 zone. That zone marks the lowest point of April.
Alternatively, if EUR/USD climbs back above the 1.0896 area, which is the low of May 4th, this may attract a few extra buyers into the game. Such a move might give a bit more confidence to the bulls, who could lift the pair to the 1.0926 barrier, marked by yesterday’s high, a break of which could set the stage for a further uprise. That’s when we will once again aim for the 1.1018 and 1.1038 levels, marked by the high of May 1st and April 1st respectively.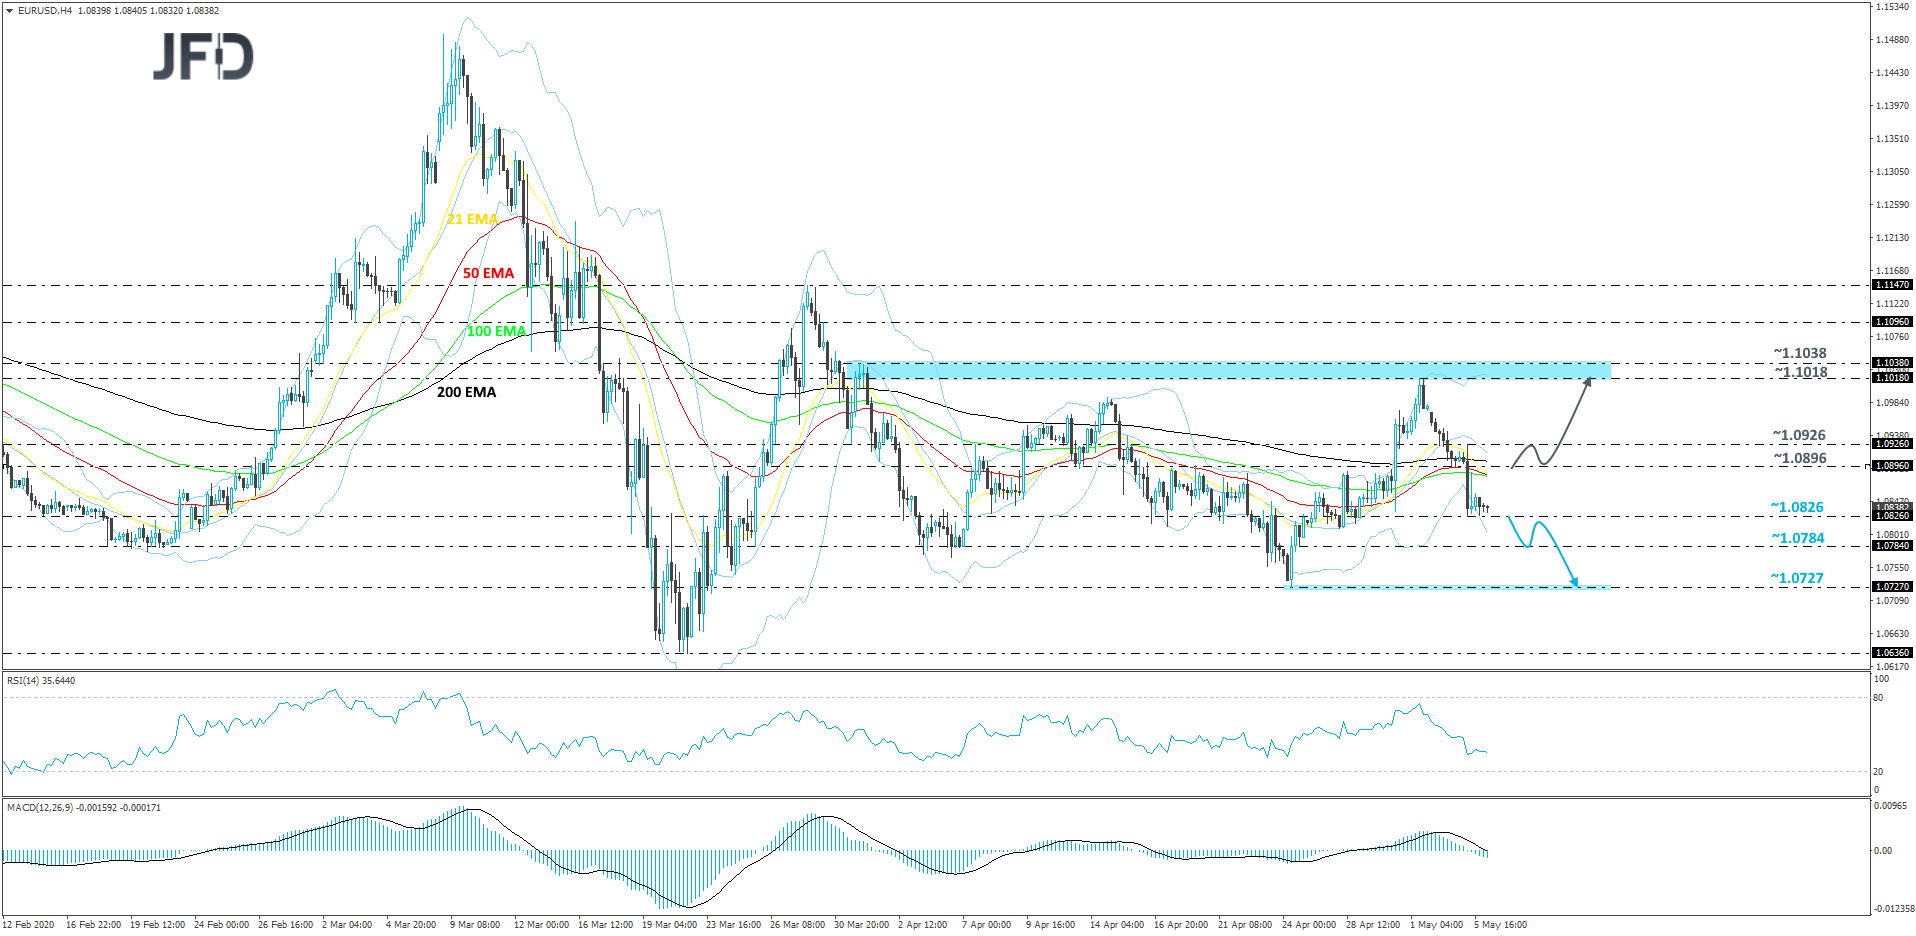
AS FOR THE REST OF TODAY’S EVENTS
From the eurozone, we get the final services and composite PMIs for April from the nations of which we got the manufacturing prints on Monday, as well as from the bloc as a whole. As usual, expectations are for confirming their initial estimates. The euro area retail sales for March are also coming out and they are expected to have tumbled 10.5% after rising 0.9% in February.
With regards to the energy market, we get the EIA (Energy Information Administration) weekly report on crude oil inventories. Expectations are for a 7.76mn barrels inventory build, following an increase of nearly 9mn the week before. Given that the API (American Petroleum Institute) report, released overnight revealed a 8.4mn barrels build, we would consider the risks of the EIA forecast as tilted slightly to the upside.
As for tonight, during the Asian morning Thursday, we get Australia’s trade balance for March and China’s Caixin Services PMI for April. Australia’s trade surplus is expected to have increased to AUD 6.8bn from AUD 4.36bn, while no forecast is available for China’s Caixin index. That said, bearing in mind that the official non-manufacturing PMI rose to 53.2 from 52.3, we see the case for the Caixin index to have moved in a similar fashion.
