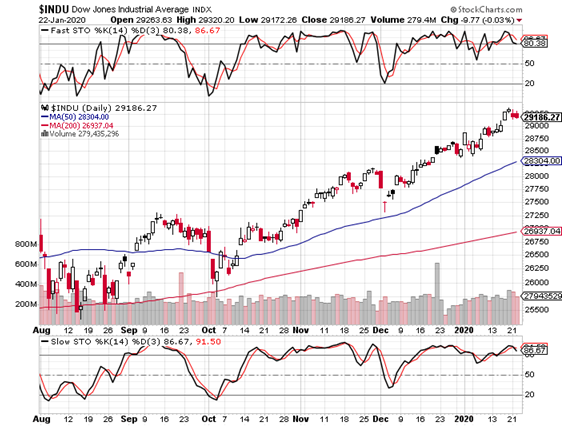
The perfect Dow peak, along with silver’s pre-acceleration higher low will likely have been seen this week or next. Confidence is high.
Dow: With respect to the index, the articles referenced in today’s report discussed these events as plausible for the first week of January, consistent with prior years when major tops were made in the year’s opening month. The year’s first week is holiday-shortened as managers trickle back into the office post-yearend window-dressing, so we must paint with a slightly broader brush.
From the December 2, 2019 report:
“WARNING: At major cycle peaks, I have cautioned that blow-offs occur to nice round headline-grabbing numbers. In this case, 30,000 is such a number, just as 40,000 was the Nikkei’s number to watch 30 years ago. Included in the warning, note that a fancy number serves a “magnet” that is front-run by smart money.
“Just as the Nikkei’s summit was just over 39,000 on the first day of 1990, could the Dow peak at a level somewhere between 29,000 - 30,000 during the first week of 2020?”
With respect to silver, all of my momentum indicators and wave counts are satisfied for a silver acceleration from the higher low contemplated in the December 2, 2019 article, in which it was discussed that the orthodox low may coincide with the yearend time cycle bottom, and that the price low could either take place then, or a month earlier, therefore. From that December report:
“In the past, however, when I have written of that cycle, the metal’s unorthodox (Elliott terminology) bottom occurred a month early, as it occasionally does, thereby putting in a higher price low that coincides with the time cycle bottom.”
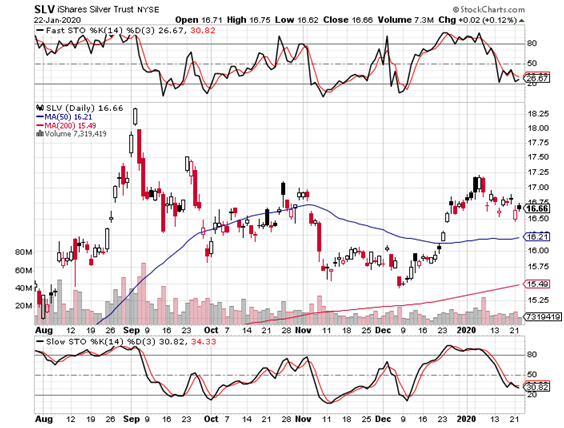
In the STRATEGY section below, the chart of the silver ETF, the SLV, one can plainly note a corrective near term pattern, which I believe is concluding.
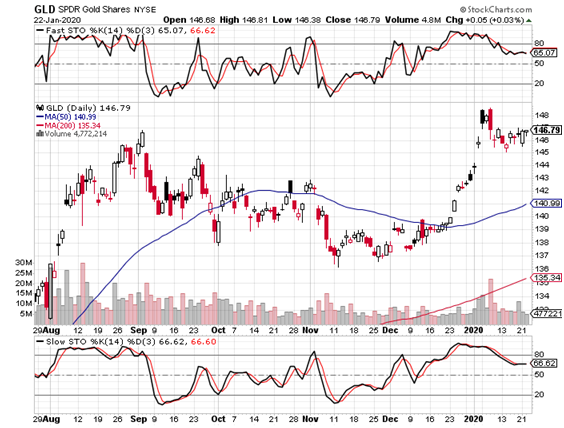
One would ordinarily conclude that the gold ETF GLD chart which follows it is NOT correcting; however, the latter’s near term correction is up-trending. To the Elliott-trained eye, gold is actually correcting; this is inferred from the fact that silver is correcting.
The correct conclusion to draw from such analyses is that the precious metals are strong (inferred from gold’s up-trending correction) and that one may expect silver to accelerate and catch up to gold.
Yes, it’s intuitively twisted….but not philosophically circular. Most importantly, such analysis of the PMs has served well for many years.
From the August 29, 2019 article:
“The inter-relationship of the patterns of the two metals confuses investors. The sole observation about which most all investors agree is that gold leads silver due to its liquidity. For trading and investing in these metals, the most important point, however, is that one may glean gold’s wave count by noting silver’s own Elliott pattern, since they are the same. This must be underscored.
“If one can correctly identify silver’s wave count, one would anticipate gold’s major movements..."
Illustration of the analysis above become self-evident, when comparing the 6-month charts and indicators of the SLV and GLD; they follow immediately hereunder, respectively.


STRATEGY:
DOW:
Prior articles have advised a systematic trading program for protecting one’s wealth. Specifically, as regards the Dow (US indexes), one’s strategy may employ a put combination that is mathematically engineered to provide substantial profits in the event of a bear market-style decline, while generating profits, however minor, in the event of a much-unexpected continued advance, or in the case of bear market rallies, as the case may be.

As we see from the chart immediately above, the Dow’s momentum indicators are rolling over, while long term charts (not included) illustrate the index’s trend as bound by the line created by connecting the peaks from December 2017 – July 2019 (as discussed in the August 29, 2019 article).
SILVER:
As I only advise being long precious metals, there is no question of hedging them, but merely utilizing their option contracts to leverage one’s PM portfolio in the strategic manner that one wishes.
Therefore, these reports have advised looking at the 2-year SLV 18 and 19 strike prices as ideal for long term call option speculations.
For transparency, this week, I purchased the January 2021 19-strike calls at $0.84 (today’s close: .87 - .88), as well as the January 2022 19-strike calls at $1.80 (today’s close: 1.78 – 1.87).
For a shorter term play, I also purchased the April-March 2020 18-strike “calendar” call spread for $0.09 (today’s close: .08 - .10).
Albeit a shorter term spec, the strategy in the latter case is to benefit from the safest and strongest part of the 6-month cycle, while aiming to establish a very low cost-base from which to enjoy exceptional leverage, though still laying the heaviest weight of consideration on risk aversion.
18-19 defines the key zone above which the SLV may accelerate, though 18 is also a level that could become a “magnetic” support upon a break into that important area.
In all cases, as with the Dow or S&P options, these precious metals options markets are extremely deep and liquidity is, therefore, a non-issue.
